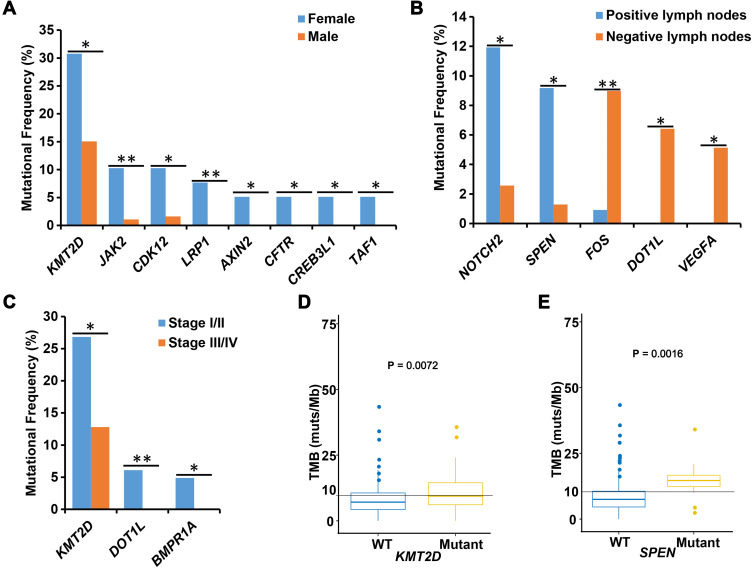
Figure 3.
Correlation analyses between mutated genes and clinical characteristics. (A) The association between mutated genes and sex. The X-axis displays each detected gene and the Y-axis displays the mutation frequency of these genes. Blue represents female patients and red represents male patients. (B) The correlation analysis between lymph node status and mutated genes. The X-axis displays each mutated gene and the Y-axis displays the mutation frequency of those genes. (C) The association between mutated genes and tumor differentiation. The X-axis displays each detected gene and the Y-axis displays the mutation frequency of these genes. Blue represents tumor stage I/II (early) and red represents tumor stage III/IV (advanced). (D and E) The association between mutated genes and tumor mutational burden. The X-axis displays mutation status of each target gene, and Y-axis displays the tumor mutational burden value. WT, wild type target gene; Mutant, mutated target gene. *, P < 0.05 and **, P < 0.01.

