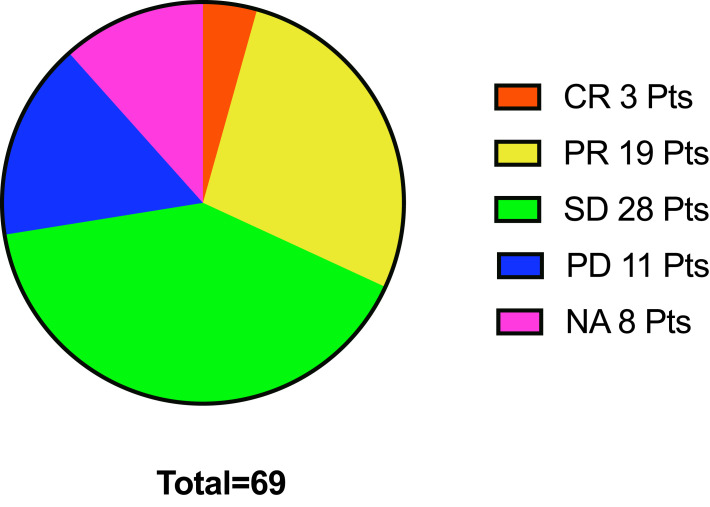
Figure 4.
Intracranial response in the pBM group. This pie chart shows 3 patients with CR,19 with PR, 28 with SD, 11 with PD, and 8 NA (not assessed). The response of intracranial ORR was 31.9%, IDCR 72.5% in prior BM group.
Abbreviations: BMs, brain metastases; pts, patients; ICIs, immune checkpoint inhibitors; CR, complete response; PR, partial response; SD, stable disease; PD, progressive disease; NA, not assessed; ORR, objective response rate; IDCR, intracranial disease control rate.

