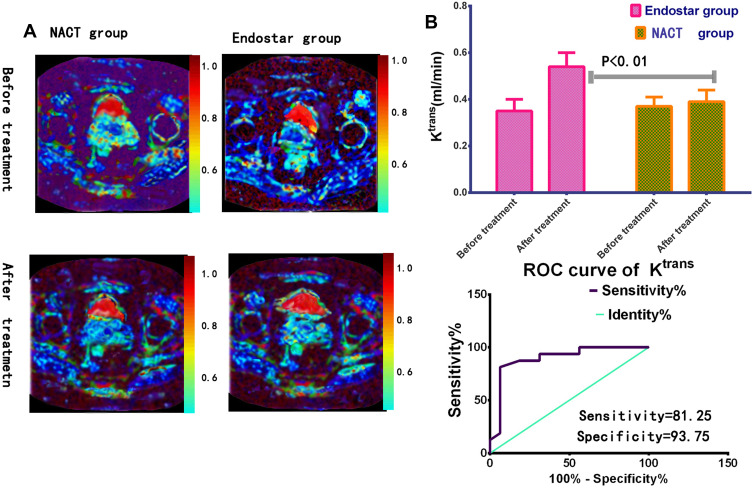
Figure 4.
The Ktrans value detection in endostar treatment. (A) Parametric maps in different groups of volume transfer constant (Ktrans) were presented by DEC-MRI. (B) One week after treatment, Ktrans values of tumors increased distinctly in endostar than NACT group. Receiver operating characteristic (ROC) analysis between endostar and NACT group was carried out. The area under curve (AUC) was 0.8965 (P<0.01).

