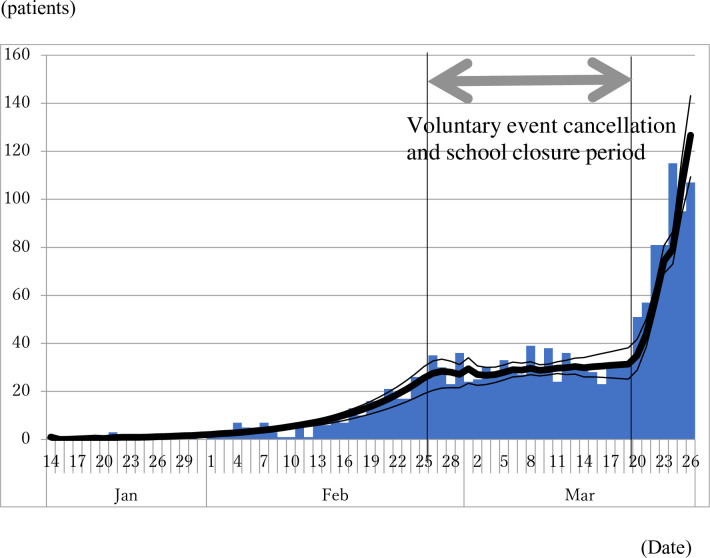
Fig 2. Observed epidemic curve of COVID-19 patients and predicted epidemic curve from the model based on the estimated reproduction number.
Bar indicates the observed epidemic curve and bold line indicates the predicted line based on the estimated reproduction numbers. Thin lines indicate range of the best fit line at each bootstrapping iteration. Between two vertical lines indicates voluntary event cancellation and school closure period.

