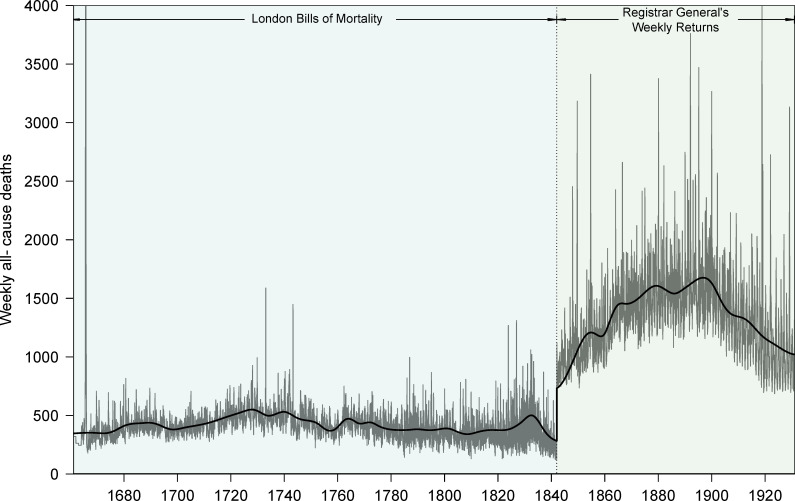
Fig 4. Weekly all-cause deaths in London, England, 1661–1930.
The trend was estimated by Empirical Mode Decomposition (see Methods) applied separately to the periods 1661–1841 and 1842–1930, which correspond to different data sources. Two peaks are cut off in the plot. During the Great Plague of London, deaths reached 8,297 per week in September 1665. During the 1918 influenza pandemic, deaths reached 4,290 per week in November 1918. The data and R script required to reproduce this figure are available at https://github.com/davidearn/London_smallpox.

