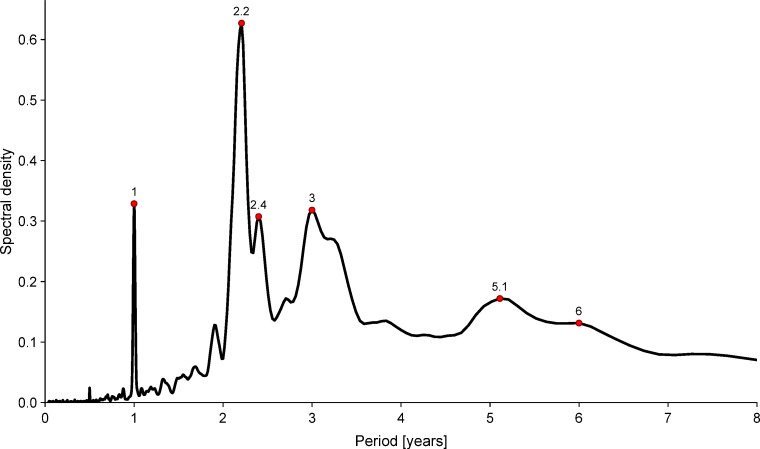
Fig 5. Classical Fourier power spectrum of the normalized weekly smallpox mortality time series for London, England, 1664–1930.
Before computing the power spectrum, the time series was square-root transformed and detrended [84]. A standard modified Daniell smoother was used in the computation of the spectrum (see Methods). The data and R script required to reproduce this figure are available at https://github.com/davidearn/London_smallpox.

