

Abstract
Candida albicans is a common mucosal colonizer, as well as a cause of lethal invasive fungal infections. The major predisposing factor for invasive fungal disease is a compromised immune system. One component of the host immune response to fungal infection is the activation of the inflammasome, a multimeric protein complex that is critical for regulating host pro-inflammatory responses. Here, we describe methods for investigating the interactions between Candida albicans and host macrophages, with a focus on the inflammasome. C. albicans isolates differ in the degree to which they activate the inflammasome due to differences in internalization, morphogenic switching, and inflammasome priming. Therefore, we include protocols for identifying these factors. This simple in vitro model can be used to elucidate the contributions of specific C. albicans strains or mutants to different aspects of interactions with macrophages.
Keywords: Candida albicans, Macrophages, Inflammasomes, Pyroptosis
Introduction
The innate immune system is the first line of defense against pathogens, offering broad protection from invading microorganisms. Innate phagocytic cells maintain a critical role in counteracting fungal infection (Drummond et al., 2014a), facilitated by the interaction between immune cell pattern recognition receptors (PRRs) and fungal pathogen associated molecular patterns (PAMPs). Recognition of fungal PAMPs by macrophages stimulates the priming and activation of the macrophage inflammasome cellular machinery resulting in an inflammatory cell death program known as pyroptosis (Tavares et al., 2015a). In the case of Candida albicans, macrophage pyroptosis is dependent on CASP-1 and NLRP3 (Wellington et al., 2014; Krysan et al., 2014). The formation of the NLRP3 inflammasome comprises two distinct signals, referred to as Priming and Activation. Priming results in the transcriptional upregulation of inflammasome components, notably NLRP3 and pro-IL1β. Activation involves the oligomerization of a multi-protein complex including NLRP3, CASP-1, and ASC. This oligomerization mediates the cleavage of Gasdermin D, releasing its active component which can then oligomerize and form pores in the cell membrane (Liu et al., 2016), and the cleavage of pro-IL1β, which is then released through cell pores in its highly inflammatory active IL-1β state (Swanson et al., 2019a).
Understanding the cellular signals that stimulate the macrophage inflammasome response requires monitoring both priming and activation in macrophages infected with fungal cells. Additionally, as most mutants that fail to transition to the filamentous form are also defective in inflammasome activation, it is critical to monitor the morphology of the fungus during infection. The methods presented here focus on the interactions between C. albicans and macrophage cells in vitro, allowing for measurement of inflammasome stimulation. This assessment is particularly suited for comparison of the signals that induce macrophage response amongst different fungal isolates or mutants.
Basic Protocol 1:
Measuring Inflammasome Priming in Response to C. albicans focuses on measuring inflammasome priming in response to fungi by monitoring the transcriptional upregulation of NLRP3 and pro-IL1B with qRT-PCR. Basic Protocol 2: Measuring Inflammasome Activation in Response to C. albicans utilizes the oligomerization of the inflammasome component ASC as a marker for inflammasome activation, allowing for the determination of the proportion of infected macrophages with activated inflammasomes. When using this method to compare the inflammasome response to multiple C. albicans strains or isolates, Supplementary Protocol 1: Controlling for Phagocytosis presents a microscopy-based approach to quantify differences in phagocytosis levels between fungal isolates to preclude any confounding effects in inflammasome activation due to differences in fungal internalization.
Basic Protocol 1: Measuring Inflammasome Priming in Response to C. albicans
This in vitro method monitors the inflammasome response of macrophages in response to Candida albicans via transcriptional profiling. A macrophage monolayer is co-incubated with fungal cells to initiate infection. The cells are collected at a specified time post infection to monitor transcription of inflammasome components. To ensure priming is specific to C. albicans, this method excludes additional exogenous stimulation of inflammasome priming, such as by LPS. Because this protocol focuses on the macrophage response, it is well-suited for comparing the rates of inflammasome priming in response to various fungal isolates or mutants.
Materials:
ASC-fluorescent protein reporter macrophage cell line (e.g., as prepared in (Stutz et al., 2013)
RPMI + 10% FBS + antibiotics/antimycotics (see recipe in Reagents and Solutions)
RPMI + 3% FBS (see recipe in Reagents and Solutions)
Cell Culture Phosphate Buffered Saline (PBS) (Fisher Scientific, MT21040CV)
0.4% Trypan Blue Solution (Sigma Aldrich, T8154)
C. albicans strains (e.g., SC5314 wild type obtained from ATCC)
YPD broth (see recipe in Reagents and Solutions)
AffinityScript Multiple Temperature cDNA Synthesis kit (Agilent, 600105)
- qRT-PCR primers
- Mouse 18S forward: TCAACTTTCGATGGTAGTCGCCGT
- Mouse 18S reverse: TCCTTGGATGTGGTAGCCGTTTCT
- NLRP3 forward: GCTCCAACCATTCTCTGACC
- NLRP3 reverse: AAGTAAGGCCGGAATTCACC
- IL-1B forward: GCTTCAGGCAGGCAGTATC
- IL-1B reverse: AGGATGGGCTCTTCTTCAAG
Thermopol Reaction Buffer Pack (NEB, B9004S)
dNTPs (Alkali Scientific, C767)
Magnesium Sulfate Solution (NEB, B1003S)
SYBR Green I Nucleic Acid Stain (Lonza, 50513)
Hot Start Taq DNA Polymerase (NEB, M1495S)
Cell culture flask (Alkali Scientific, TVN0025)
37°C CO2 incubator (e.g., PHCbi MCO-170AICUVL-PA)
Water bath (e.g., Benchmark myBath 8L water Bath)
Cell culture microscope (e.g., Olympus CKX53)
Vacuum Aspirator (VWR, 89091-050)
10 mL Serological Pipettes (Life Technologies Corporation, 170367)
Cell Scraper (Alkali Scientific, C30040)
15 mL conical tube (Alkali Scientific, CN5600)
Culture tube (e.g., Fisherbrand 14-961-28)
30°C incubator (e.g., Thermo Heratherm 51028327)
Cell Culture Roller Drum (e.g., Cel-Gro Tissue Culture Rotator)
Centrifuge with 96-well plate rotor adaptor (e.g., Hettich Rotofix 32A Benchtop Centrifuge)
1.5 mL microcentrifuge tubes (Fisher Scientific, 3451)
Sterile pipette tips (Rainin, 30389276)
Nanodrop spectrophotometer (e.g., NanoDrop OneC Spectrophotometer)
Microamp Fast Optical 96 Well Reaction Plate, 0.1 mL (Fisher Scientific, 43–469-07)
Microamp Optical Adhesive Film (Fisher Scientific, 43-119-71)
qRT-PCR thermocycler (e.g., Eppendorf MasterCycler)
Preparation of Macrophages for Infection
Grow ASC-fluorescent protein reporter macrophages to ~80% confluent monolayer in a cell culture flask in RPMI + 10% FBS + antibiotics/antimycotics.
- Pre-Warm RPMI + 3% FBS and PBS in a 37 °C water bath or incubator.
- RPMI without antibiotics or antimycotics is prepared to facilitate co-culture of macrophages with fungi.
- Decreasing serum helps synchronize cells to the same cell cycle phase and will facilitate phagocytosis.
- Remove spent media from the cell culture flask using a vacuum aspirator or serological pipette and discard.
- Take care not to disrupt the adherent monolayer or dislodge macrophages into the media to be discarded.
Add 10 mL of pre-warmed PBS to the flask. Gently rock the flask to wash the monolayer, then remove the PBS with a sterile aspirator or serological pipette and discard.
- Harvest macrophages by adding 10 mL of pre-warmed RPMI + 3% FBS to the flask. Resuspend cells in the media by gently scraping with a cell scraper to dislodge the monolayer. Gently mix to suspend cells in media. Transfer the cell suspension to a sterile 15 mL disposable tube using a serological pipette.
- Gentle scraping will dislodge the monolayer into suspension as desired. Scraping or pipetting that is too vigorous may damage cell integrity and reduce the viable cell population.
- Measure viable cell concentration using a hemocytometer by combining equal volumes of cell suspension and 0.4% Trypan Blue prior to enumeration.
-
Trypan Blue is excluded from healthy, viable cells. As it only stains cells with damaged membranes, it distinguishes live and dead cells. By enumerating only unstained cells after treating with Trypan Blue, an approximate viable cell count can be obtained.
-
Dilute macrophages to a concentration of 6 × 10⁵ cells/mL in RPMI + 3% FBS.
Add 10 mL of diluted cell suspension to a T25 tissue culture flask.
Incubate the flask at 37°C with 5% CO2 for approximately 16 hours / overnight.
Prepare C. albicans cells for Infection
-
2
Prepare C. albicans cells for infection on the same day as preparing macrophages for infection.
-
3
Aseptically inoculate 5 mL of YPD with a single colony of C. albicans in a culture tube. Incubate overnight at 30°C in a rotating or shaking incubator.
-
4
Measure viable fungal cell concentration on the day of infection by combining equal volumes of cell suspension and 0.4% Trypan Blue and enumerating with a hemocytometer.
-
5
Dilute C. albicans cells to a concentration of approximately 1.2 × 10⁶ cells/mL in RPMI + 3% FBS for an MOI of approximately 2:1 in a 10 mL volume.
Infect Macrophages
-
6Following the approximately 16-hr incubation, remove media from the tissue culture flask prepared with ASC-fluorescent protein reporter macrophages using a 10 mL pipette or sterile aspirator.
- Before infection, confirm by microscopy that the macrophages are at ~80% confluence and evenly distributed throughout the flask.
- Take care to remove media by orienting a pipette or aspirator tip along the side of the flask so as not to disrupt the monolayer.
-
7
Add 10 mL of C. albicans suspension prepared in RPMI + 3% FBS to each infection flask.
-
8
Add 10 mL of RPMI + 3% FBS to the media control flask.
-
9Centrifuge the flasks at 1000 rpm for 1 min to synchronize the infections.
- This centrifugation helps synchronize the co-incubation of macrophages and fungi across prepared replicates. Without this step, the fungal cells will fall to the bottom of the well at variable speeds.
-
10
Incubate at 37°C with 5% CO2 for 4 hours when monitoring activation.
-
11Remove media from infection flasks leaving the monolayer behind.
- Collect and sterilize contaminated media with bleach or other approved protocol before disposal.
Extract RNA
-
12
Add 10 mL of PBS to the flask, rocking the flask to gently wash the monolayer. Remove and discard the PBS.
-
13
Add 1 mL of PBS to the flask and resuspend cells by using a cell scraper to gently dislodge the monolayer.
-
14
Transfer the contents of the flask into a sterile 1.5 mL microcentrifuge tube using a sterile 5 mL pipette.
-
15
Centrifuge tube at 1000 rpm for 1 minute at room temperature to pellet cells.
-
16
Remove and discard supernatant without disturbing the cell pellet.
-
17
Add 100 μL PBS to the tube and gently resuspend the cell pellet.
-
18Place microcentrifuge tubes immediately on dry ice to snap freeze.
- This will help in lysis of macrophages and will preserve RNA until extraction. Samples may be kept at −80°C.
-
19Extract RNA using the Qiagen RNeasy Kit, according to the manufacturer’s current protocol.
- Keep extracted RNA on ice.
-
20Determine the levels and quality of RNA using a nanodrop spectrophotometer
- Equivalent RNA concentrations are necessary for the cDNA conversion step.
Perform qRT-PCR
-
21
Convert 1 μg of RNA to cDNA using the AffinityScript Multiple Temperature cDNA Synthesis kit and the provided random primers, according to the manufacturer’s current protocol.
-
22Create a 5 μM primer mix for each gene of interest.
- From 100 uM primer stocks, use 5 uL of each primer and 90 uL of water.
-
23
Make a sufficient quantity of SYBR green master mix for the entire experiment (Table 1).
-
24
Make a sufficient quantity of gene-specific mix for each gene by combining SYBR green master mix, sterile water, and the appropriate primer mix (Table 2).
-
25Perform each qRT-PCR reaction in technical triplicate. In a sterile qRT-PCR plate, add 1 μL of template and 9 μL of the appropriate gene-specific mix (Table 3) for each 10 μL reaction.
- Make sure to include triplicate replicates of no-template controls and no-RT controls for each gene of interest.
-
26
Cover plate with qRT-PCR film, being careful to not leave any fingerprints.
-
27Centrifuge the plate at 1000 rpm for 1 min.
- This ensures that no bubbles will inhibit signal detection.
-
28
Perform qRT-PCR under the thermocycling parameters outlined in Table 3: qRT-PCR Thermocycling Parameters.
-
29
Analyze raw data using the associated software (e.g., Eppendorf RealPlex), using the automatic cycle threshold (Ct) setting for assigning baseline and threshold for Ct determination.
Table 1:
2X SYBR Green Master Mix
| Reagent | Volume (µL) | |
|---|---|---|
| 1X | 96X | |
| H2O | 7.34 | 352.5 |
| thermopolbuffer | 2.08 | 100 |
| 10 mM dNTP | 0.26 | 12.5 |
| 100 mM MgSO4 | 0.52 | 25 |
| SYBR green I | 0.10 | 5 |
| Hot Start DNA Polymerase | 0.10 | 5 |
Table 2:
Gene-specific mix for qRT-PCR
| Reagent | Volume (µL) |
|---|---|
| 1X | |
| 2X SYBR Master Mix | 5 |
| 5 μM Primer Mix | 1 |
| H2O | 3 |
Table 3:
qRT-PCR Thermocycling Parameters
| Temperature | Duration | Number of Cycles |
|---|---|---|
| 95°C | 3 min | 1x |
| 95°C | 3 sec | 40x |
| 55°C | 20 sec | |
| 68°C | 20 sec | |
| 95°C | 15 sec | 1x |
| 60°C | 15 sec | 1x |
| 95°C | Increase Temperature over 20 min | 1x |
| 95°C | 15 sec | 1x |
Basic Protocol 2: Measuring Inflammasome Activation in Response to C. albicans
This in vitro method monitors the inflammasome response of macrophages to Candida albicans. A macrophage monolayer is co-incubated with fungal cells to initiate infection. The infected cells are fixed with formaldehyde at a specified time post infection to allow precision in analysis between replicates at identical timepoints. An ASC-fluorescent protein fusion macrophage cell line (Stutz et al., 2013) is used for assessment of inflammasome activation, as ASC oligomerization events in infected cells can be visualized using fluorescence microscopy without additional manipulation. Alternatively, fluorescently conjugated antibodies to inflammasome components ASC or Nlrp3 can be utilized to identify inflammasome formation following infection of other macrophage populations or cell lines, though not covered in this protocol.
Materials:
ASC-fluorescent protein reporter macrophage cell line (e.g., as prepared in (Stutz et al., 2013)
RPMI + 10% FBS + antibiotics/antimycotics (see recipe in Reagents and Solutions)
RPMI + 3% FBS (see recipe in Reagents and Solutions
Cell Culture Phosphate Buffered Saline (PBS) (Fisher Scientific, MT21040CV)
0.4% Trypan Blue Solution (Sigma Aldrich, T8154)
C. albicans strains (e.g., SC5314 wild type strain obtained from ATCC)
YPD broth (see recipe in Reagents and Solutions)
4% Paraformaldehyde (Polysciences, 04018-1)
Cell culture flask (Alkali Scientific, TVN0025)
37°C CO2 incubator (e.g., PHCbi MCO-170AICUVL-PA)
Water bath (e.g., Benchmark myBath 8L water Bath)
Cell culture microscope (e.g., Olympus CKX53)
Vacuum Aspirator (VWR, 89091-050)
10 mL Serological Pipettes (Life Technologies Corporation, 170367)
Cell Scraper (Alkali Scientific, C30040)
15 mL conical tube (Alkali Scientific, CN5600)
Hemocytometer (Fisher Scientific, 02-671-51B)
96-well Cell Culture Plate (Alkali Scientific, TPN1096-NT)
Culture tube (e.g., Fisherbrand 14-961-28)
30°C incubator (e.g., Thermo Heratherm 51028327)
Cell Culture Roller Drum (e.g., Cel-Gro Tissue Culture Rotator)
Fluorescent Inverted Microscope (e.g., Olympus iX80)
Preparation of Macrophages for Infection
-
1Grow ASC-fluorescent protein reporter macrophages to ~80% confluent monolayer in a cell culture flask in RPMI + 10% FBS + antibiotics/antimycotics
- ASC-fluorescent protein reporter macrophages allow for ready observation of ASC speck formation as a marker of inflammasome activation under a fluorescence microscope. Alternatively, activation can be measured similarly in other macrophage cell lines by utilizing anti-ASC (Biolegend, 676502) or anti-NLRP3 (ThermoFisher, MA5–23919) antibodies and secondary fluorescent antibodies following coincubation with C. albicans.
-
2Pre-Warm RPMI + 3% FBS and PBS in a 37 °C waterbath or incubator.
- RPMI without antibiotics or antimycotics is prepared to facilitate co-culture of macrophages with fungi.
-
3Remove spent media from the macrophage-containing cell culture flask using a vacuum aspirator or serological pipette and discard.
- Take care not to disrupt the adherent monolayer or dislodge macrophages into the media to be discarded.
-
4
Add 10 mL of pre-warmed PBS to the flask. Gently rock the flask to wash the monolayer, then remove the PBS with a sterile aspirator or serological pipette and discard.
-
5Harvest macrophages by adding 10 mL of pre-warmed RPMI + 3% FBS to the flask. Resuspend cells in the media by gently scraping with a cell scraper to dislodge the monolayer. Gently mix to suspend cells in media. Transfer the cell suspension to a sterile 15 mL disposable tube using a serological pipette.
- Gentle scraping will dislodge the monolayer into suspension as desired. Scraping or pipetting that is too vigorous may damage cell integrity and reduce the viable cell population.
-
6Measure viable cell concentration using a hemocytometer by combining equal volumes of cell suspension and 0.4% Trypan Blue prior to enumeration.
- Trypan Blue is excluded from healthy, viable cells. As it only stains cells with damaged membranes, it allows distinction between live and dead cells. By enumerating only unstained cells after treating with Trypan Blue, an approximate viable cell count can be obtained.
-
7
Dilute macrophages to a concentration of 6 × 10⁵ cells/mL in RPMI + 3% FBS.
-
8Add 100 μL of diluted cell suspension to each well in a 96-well Cell Culture Plate.
- Using a multichannel pipette and a sterile reservoir for this step may reduce variability when preparing numerous replicates. Pipette cells along the side of the wells to prevent pooling of cells in well centers.
- Prepare the appropriate number of infection wells to perform the assay in technical triplicate per fungal strain of interest.
-
9
Incubate the plate at 37°C with 5% CO2 for approximately 16 hours.
Prepare C. albicans cells for Infection
-
10
Prepare C. albicans cells for infection on the same day as preparing macrophages for infection.
-
11Aseptically inoculate 5 mL of YPD with a single colony of C. albicans in a culture tube. Incubate overnight at 30°C in a rotating or shaking incubator.
- Fungal cultures can also be prepared in 96-well plates and incubated overnight at 30°C. These cultures will reach a lower culture density than those obtained from rotating cultures.
-
12
Measure viable fungal cell concentration on the day of infection by combining equal volumes of cell suspension and 0.4% Trypan Blue and enumerating with a hemocytometer.
-
13
Dilute C. albicans cells to a concentration of approximately 1.2 × 10⁶ cells/mL in RPMI + 3% FBS for an MOI of approximately 2:1.
Infect Macrophages
-
14Following the approximately 16-hr incubation, remove media from each well of the tissue culture plate prepared with ASC-fluorescent protein reporter macrophages using a pipette or sterile aspirator.
- Before infection, confirm by microscopy that the macrophages are at ~80% confluence and evenly distributed throughout the well.
- Take care to remove media by orienting a pipette or aspirator tip along the side of each well so as not to disrupt the monolayer at the base of each well.
-
15
Add 100 μL of C. albicans suspension prepared in RPMI + 3% FBS to each infection well.
-
16
Add 100 μL of RPMI + 3% FBS to the media control wells.
-
17Centrifuge the 96-well plate at 1000 rpm for 1 min to synchronize the infections.
- This centrifugation helps synchronize the co-incubation of macrophages and fungi across prepared replicates. Without this step, the fungal cells will fall to the bottom of the well at variable speeds.
-
18
Incubate at 37°C with 5% CO2 for 4 hours when monitoring activation.
-
19Remove media from infection wells.
- Collect and sterilize contaminated media with bleach or other approved protocol before disposal.
- Infected macrophages can now be further processed as described below, to monitor priming or activation of the inflammasome.
Monitoring Inflammasome Activation
-
20After 4 hours of infection, fix cells in a biosafety cabinet by adding 50 μL of 4% paraformaldehyde to each well
- This step can be performed with a multichannel pipette and sterile reservoir
- Four hours allows for monitoring of inflammasome activation without also measuring the second phase of macrophage cell death (Uwamahoro et al., 2014; Tucey et al., 2018).
- Note: Due to volatility, addition of paraformaldehyde to any number of wells in a 96-well plate can inadvertently fix the entire plate. Time course experiments should therefore be performed in separate 96-well plates.
-
21
Incubate plate for 10 min at room temperature to fix cells.
-
22
Remove paraformaldehyde from wells with a sterile aspirator and discard into appropriate chemical waste.
-
23
Wash each well 3X by gently adding and removing 100 μL PBS.
-
24
Add 50 μL of PBS to each well before imaging.
-
25Image macrophages on an epifluorescent microscope, using at least 20X magnification, with brightfield and the appropriate fluorescent channel.
- Overlay the brightfield and fluorescent images to identify cells with ASC specks.
- Figure 1 gives an image of a representative infected subfield and the size of the expected ASC specks.
-
26Take images of at least 4 independent frames with at least 100 phagocytic cells per well to improve reproducibility of data.
- Avoid fields with large clumps of macrophages as it makes it difficult to count individual infections.
- During acquisition, use the same imaging parameters for all wells (including light intensity and exposure times).
- Note: using the brightfield channel to focus the image will help prevent photobleaching the ASC-FP.
Figure 1:

Overlay of fluorescent and brightfield images shows macrophages infected with C. albicans and formation of the ASC speck. Arrows point to representative specks. In this subfield, all macrophages appear to contain at least one fungal cell. Scale bar indicates 50 um.
Image analysis
-
27
Open the image with ImageJ (Schneider et al., 2012) or other image analysis software.
-
28The level of filamentation of the C. albicans strains within macrophages should be determined by identifying filamentous fungi in the brightfield image.
- Many non-filamentous strains have a defect in inflammasome activation (Wellington et al., 2014), so it is important to include a control strain (such as the SC5314 wild type strain or parental strain) to determine the levels of filamentation within macrophages.
- Figure 2 shows representative filamentous and yeast cells within macrophages.
-
29Count infected macrophages using the ImageJ CellCounter plugin, using the brightfield image to identify C. albicans within the macrophage.
- Not every macrophage will contain a fungal cell, so it is important to count only the infected macrophages.
- Make sure to count every infected macrophage in the image to avoid bias.
- Permeabilizing the cells and staining with calcofluor white as in Support Protocol 1 can assist with identification of macrophages with internalized fungi.
-
30Count macrophages with a distinct ASC specks.
- Macrophages without the ASC speck will have dim but even distribution of fluorescent signal throughout the cell. The ASC specks will be bright and approximately 1 micron.
-
31
Determine the percent of ASC-speck positive cells using the formula: ASC speck+ macrophages/total infected macrophages * 100
Figure 2:

Macrophages infected with filamentous or yeast form strains of C. albicans and imaged after 4 hours of co-incubation. Scale bar indicates 50 um.
Support Protocol 1: Controlling for phagocytosis
Introductory Paragraph
When comparing inflammasome priming and activation between isolates or within a mutant library, it is important to control for the confounding effect of differing phagocytosis rates. This protocol represents a microscopic method for determining phagocytosis rates of Candida cells and can be performed for each strain for which pyroptosis rates are being considered. Because this protocol utilizes inexpensive dyes that target components of the fungal cell wall to differentiate between internalized and extracellular fungi, its application is suitable for different Candida strains or mutants, without requiring genetic manipulation of each strain to generate fluorescent labels. Furthermore, the addition of dyes following infection of macrophages preserves the native interaction between Candida cells and macrophages and avoids the possibility that pre-staining the fungal cell wall alters recognition of the fungal cells by macrophages. This is especially important for calcofluor white, which binds to chitin and can perturb cell wall integrity and trigger cell wall remodeling (Xie et al., 2016).
Materials
ASC-fluorescent protein reporter macrophage cell line (e.g., as prepared in (Stutz et al., 2013)
RPMI + 10% FBS + antibiotics/antimycotics (see recipe in Reagents and Solutions)
RPMI + 3% FBS (see recipe in Reagents and Solutions
Cell Culture Phosphate Buffered Saline (PBS) (Fisher Scientific, MT21040CV)
0.4% Trypan Blue Solution (Sigma Aldrich, T8154)
C. albicans strains (e.g., SC5314 wild type strain obtained from ATCC)
YPD broth (see recipe in Reagents and Solutions)
4% Paraformaldehyde Solution (see recipe in Reagents and Solutions)
5 μg/mL FITC-ConA (see recipe in Reagents and Solutions)
0.05% Triton X-100 (see recipe in Reagents and Solutions)
0.1 g/L Calcofluor White solution (see recipe in Reagents and Solutions)
Cell culture flask (Alkali Scientific, TVN0025)
37°C CO2 incubator (e.g., PHCbi MCO-170AICUVL-PA)
Water bath (e.g., Benchmark myBath 8L water Bath)
Cell culture microscope (e.g., Olympus CKX53)
Vacuum Aspirator (VWR, 89091–050)
10 mL Serological Pipettes (Life Technologies Corporation, 170367)
Cell Scraper (Alkali Scientific, C30040)
15 mL conical tube (Alkali Scientific, CN5600)
Hemocytometer (Fisher Scientific, 02-671-51B)
96-well Cell Culture Plate (Alkali Scientific, TPN1096-NT)
Culture tube (e.g., Fisherbrand 14-961-28)
30°C incubator (e.g., Thermo Heratherm 51028327)
Cell Culture Roller Drum (e.g., Cel-Gro Tissue Culture Rotator)
Fluorescent Inverted Microscope (e.g., Olympus iX80)
Preparation of Macrophages for Infection
-
1Grow macrophages to ~80% confluent monolayer in a cell culture flask in RPMI + 10% FBS + antibiotics/antimycotics.
- The macrophage line of choice should be the same as used in Basic Protocol 1: Measuring Inflammasome Activation in Response to C. albicans
-
2
Pre-Warm RPMI + 3% FBS and PBS in a 37°C water bath or incubator.
-
3Remove spent media from the cell culture flask using a vacuum aspirator or serological pipette and discard.
- Take care not to disrupt the adherent monolayer or dislodge macrophages into the media to be discarded.
-
4
Add 10 mL of pre-warmed PBS to the flask. Gently rock the flask to wash the monolayer, then remove the PBS with a sterile aspirator or serological pipette and discard.
-
5Harvest macrophages by adding 10mL of pre-warmed RPMI + 3% FBS to the flask. Resuspend cells in the media by gently scraping with a cell scraper to dislodge the monolayer. Gently mix to suspend cells in media. Transfer the cell suspension to a sterile disposable tube using a serological pipette.
- Gentle scraping will dislodge the monolayer into suspension as desired. Scraping that is too vigorous may damage cell integrity and reduce the viable cell population.
-
6
Measure viable cell concentration using a hemocytometer by combining equal volumes of cell suspension and 0.4% Trypan Blue prior to enumeration.
-
7
Dilute macrophages to a concentration of 6 × 10⁵ cells/mL in RPMI+3%FBS.
-
8Add 100 μL of diluted cell suspension to each well in a 96-well Cell Culture Plate.
- Usage of a multichannel pipette and a sterile reservoir for this step may reduce variability when preparing numerous replicates. Pipette cells along the side of the wells to prevent pooling of cells in the well centers.
- Make sure to include wells for three technical replicates for each infection in addition to wells for no infection controls.
-
9
Incubate the plate at 37°C with 5% CO2 for approximately 16 hours.
Prepare C. albicans Cells for Infection
-
10Prepare C. albicans cells for infection on the same day as preparing macrophages for infection: Aseptically inoculate 5 mL of YPD with a single colony of C. albicans in a culture tube. Incubate overnight at 30°C in a rotating or shaking incubator.
- Preparation of C. albicans should be performed for each strain or mutant to be compared.
-
11
Measure viable fungal cell concentration on the day of infection by combining equal volumes of cell suspension and 0.4% Trypan Blue and enumerating with a hemocytometer.
-
12
Dilute C. albicans cells to a concentration of 1.2 × 10⁶ cells/mL in RPMI + 3% FBS for an MOI of approximately 2:1.
Infect Macrophages
-
13Following the approximately 16-hr incubation, remove media from each well of the tissue culture plate prepared with macrophages using a pipette or sterile aspirator.
- Before infection, confirm by microscopy that the macrophages are at ~80% confluence and evenly distributed throughout the well.
- Take care to remove media by orienting a pipette or aspirator tip along the side of each well so as not to disrupt the monolayer at the base of each well.
-
14
Add 100 μL of C. albicans suspension prepared in RPMI + 3% FBS to each infection well.
-
15
Add 100 μL of RPMI + 3% FBS to the media control wells.
-
16Centrifuge the 96-well plate at 1000rpm for 1min to synchronize the infections.
- This centrifugation synchronizes the co-incubation of macrophages and fungi across prepared replicates.
-
17Incubate at 37°C with 5% CO2 for 30 minutes.
- At this time point, approximately 50% of C. albicans strain SC5314 are engulfed by macrophages, allowing for identification of mutants with either increased or decreased phagocytosis rates.
-
18Remove media from infection wells.
- Collect and sterilize contaminated media with bleach or other approved protocol before disposal.
-
19
Wash each well by adding 100 μL PBS then removing, taking care not to disrupt the monolayer.
-
20
Fix cells in each well by adding 50 μL of 4% paraformaldehyde solution and incubating at room temperature for 10 min.
-
21Remove and discard the paraformaldehyde, then repeat the washing of each well 3x with PBS.
- Collect and dispose of paraformaldehyde in the appropriate chemical waste containers.
Measuring Internalization
-
22Add 50 μL of 5 μg/mL FITC-ConA to each infection well. Wrap the plate in foil to protect from light, then incubate 30 min at room temperature with gentle rocking.
- ConA binds mannans in the fungal cell wall. As it is membrane impermeable, adding FITC-ConA to the fixed cells at this stage will only stain external Candida cells and not internalized cells.
- Note: ConA will bind the endoplasmic reticulum of mammalian cells and so should not be used after membrane permeabilization.
-
23
Wash each well 3x by adding and removing 100 μL PBS.
-
24
Add 50 μL of 0.05% Triton X-100 to each well. Incubate at room temperature for 15 min to permeabilize the cells to allow staining of internalized Candida.
-
25
Wash each well 3x by adding and removing 100 μL PBS.
-
26
Add 100 μL of 0.1 g/L Calcofluor White solution to each well. Incubate 10 min at room temperature, protecting samples from light.
-
27
Wash each well 3x by adding and removing 100 μL PBS.
-
28Add 100 μL PBS to each well to cover the cells.
- The plate can now be stored at 4°C and wrapped in foil to protect from light until ready to image.
-
29Image stained cells using fluorescence microscopy.
- Calcofluor white has a peak excitation wavelength of 350nm and emission wavelength of 432 nm. FITC has a peak excitation wavelength of 495 nm and emission wavelength of 51 9nm.
- Figure 3 shows representative calcofluor white and FITC-ConA staining of C. albicans incubated with macrophages for 30 minutes.
-
30Count the number of FITC-ConA positive Candida cells and the number of Calcofluor White positive Candida cells. FITC-ConA positive cells include only external Candida, whereas Calcofluor White positive cells include all Candida, both internalized and external.
- Quantifying from images of at least 4 independent frames with at least 100 phagocytic cells per well improves reproducibility of data.
-
31Determine the percentage of phagocytized fungal cells for each replicate using the following formula:
Figure 3:
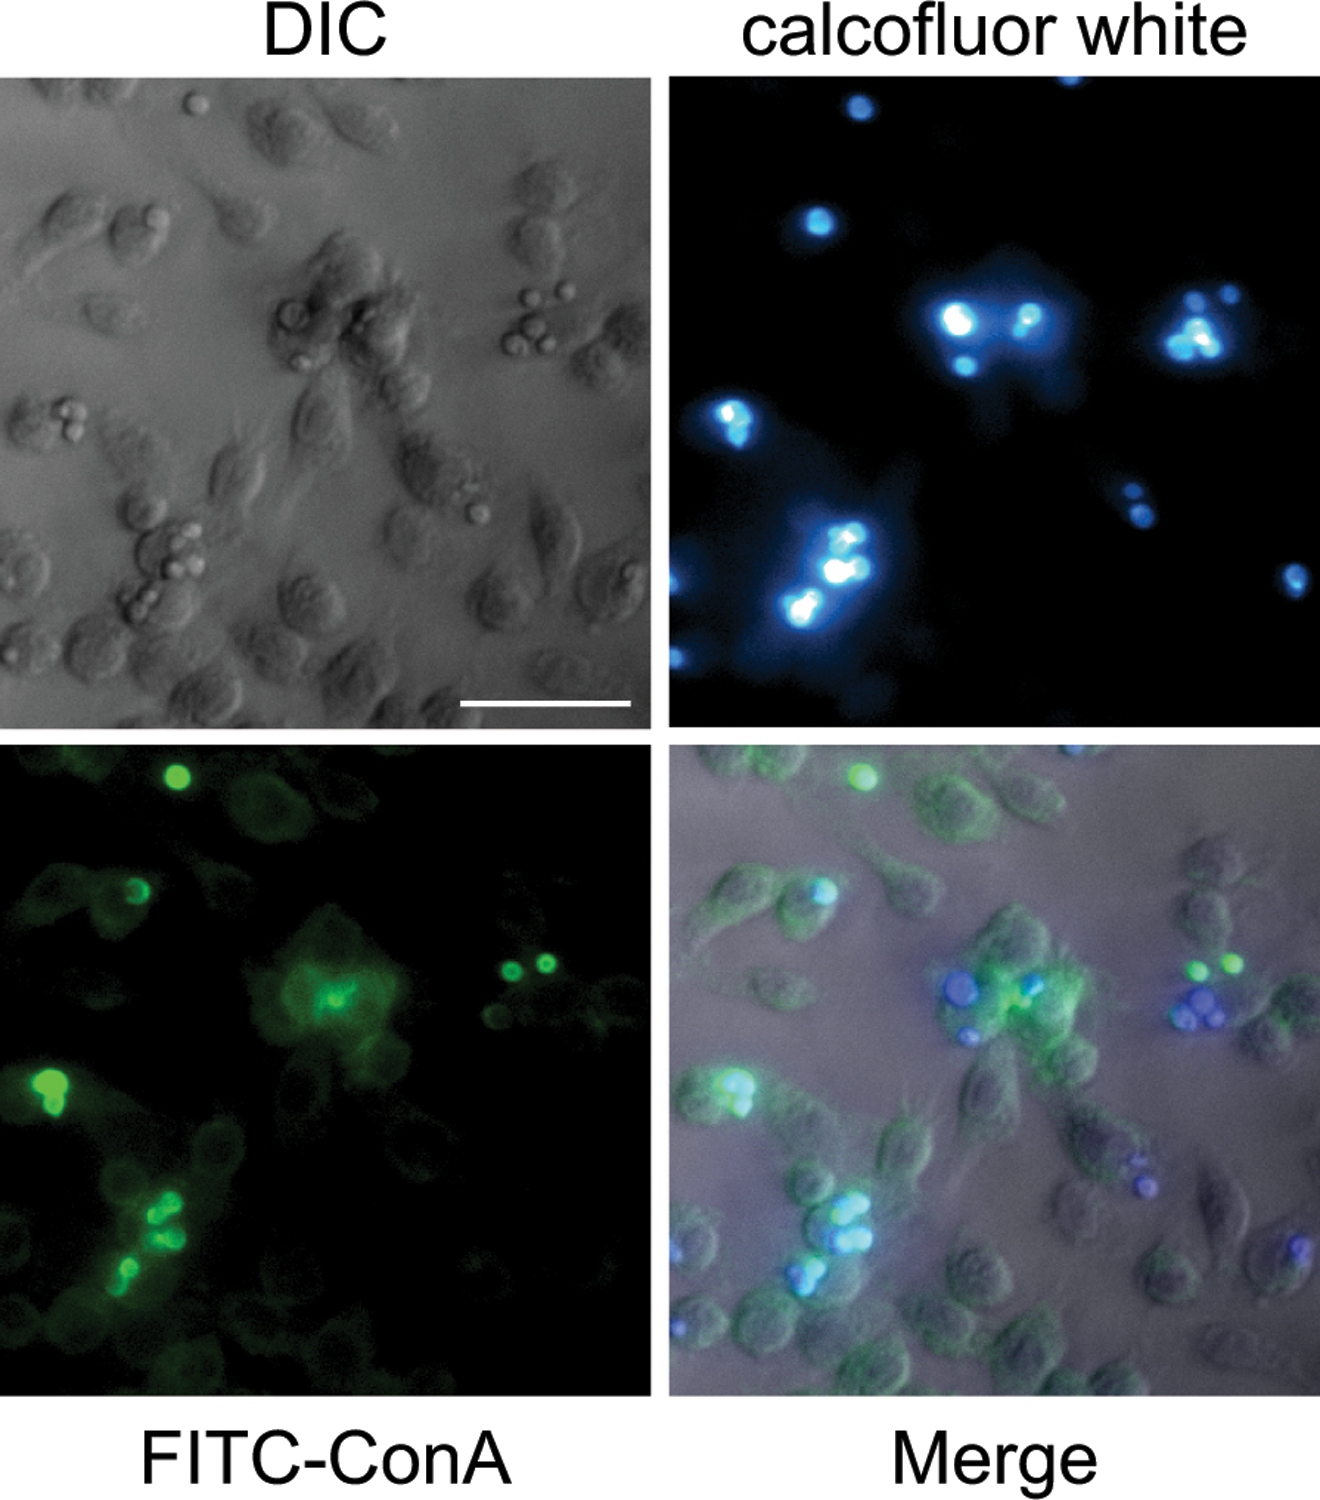
Staining with ConA and Calcofluor white to identify internalized C. albicans. Scale bar indicates 50 um.
Reagents and Solutions
0.1 g/L Calcofluor White: Dilute Calcofluor White Solution (Sigma Aldrich, 18909–100ML-F) to a final concentration of 0.1 g/L Calcofluor White.
5 μg/mL FITC-ConA: Dilute Concanavalin A - FITC Labelled (Sigma-Aldrich, C7642) to a final concentration of 5 μg/mL in PBS. Store at −20 °C in a light impermeable container.
4% Paraformaldehyde Solution: Dilute two parts 10% Aqueous Formaldehyde (Polysciences, 04018–1) with three parts purified water. Store at 2–8 °C for up to 1 week.
RPMI + 10% FBS + a/a: Aseptically remove 50 mL of RPMI from a new 500 mL RPMI bottle (Sigma-Aldrich, R8758–500ML). Add 50 mL heat-inactivated FBS to a final concentration of 10% FBS. Add 5 mL HyClone antibiotic/antimycotic 100X (Pen/Strep/Fungizone) (Fisher Scientific, SV30079.01 29131448). Store at 2–8°C.
RPMI + 3% FBS: Aseptically remove 15 mL of RPMI from a new 500mL RPMI bottle (Sigma-Aldrich, R8758–500ML). Add 15 mL heat-inactivated FBS (Fisher Scientific, SH3008803HI) to a final concentration of 3% FBS. Store at 2–8°C.
0.05% Triton X-100: Dilute Triton X-100 (Fisher Scientific, AAA16046AP) to a final concentration of 0.05% (v/v) in purified water. Store at room temperature.
Yeast extract peptone dextrose medium (YPD): Dissolve 10 g Bacto Yeast Extract (Fisher Scientific, cat. No. DF0127-07-1), 20 g Bacto Peptone (Fisher Scientific, cat. No. DF0118-07-2). Add water to raise the total solution volume to 9000 mL. Make a 20% glucose solution with 20 g Dextrose (Fisher Scientific, D16-10) to a final volume of 100 mL in purified water. Sterilize both solutions by autoclaving. Store at room temperature. Aseptically combine before use.
Commentary
Professional phagocytes, including macrophages, are a crucial component of the host response to invasive fungal infections. One aspect of the macrophage response to C. albicans infection is activation of the inflammasome, a multi-protein cytosolic complex that mediates a highly inflammatory cellular response. C. albicans triggers the formation of an NLRP3 and CASP-1 dependent inflammasome in macrophages (Wellington et al., 2014), and NLRP3 deficient mice show increased sensitivity to fungal infections (Hise et al., 2009). When mice are infected with fungal strains that fail to activate the inflammasome, the infections are characterized by a lack of polymorphonuclear cell recruitment to the foci of infection (O’Meara et al., 2018).
The inflammasome response involves priming and activation in response to fungal PAMPs, although the exact PAMPs and receptors have not been fully defined. Signal 1, or priming, results in the transcriptional upregulation of NLRP3, pro-IL1B, and other inflammasome components (Bauernfeind et al., 2009). Activation involves oligomerization of NLRP3, CASP-1, and ASC, and when the ASC protein is tagged with a fluorescent protein, it results in a fluorescent aggregate that is detectable by epifluorescent microscopy (Stutz et al., 2013).
The protocol presented here allows for investigation of different fungal characteristics that lead to differing rates of an inflammasome response in vitro.
Inflammasome priming and activation can be decoupled in response to C. albicans (O’Meara et al., 2018). For this reason, monitoring both stages is crucial to understanding the cellular signals that induce macrophage responses. Other protocols involve stimulating inflammasome priming with LPS. This step is not included in our protocol as it would hinder identification of mutants deficient in priming. Instead, the macrophages are incubated in a reduced serum media overnight to increase uptake of fungal cells. Then, priming is monitored by measuring transcriptional upregulation of NLRP3 and IL-1β using qRT-PCR.
Monitoring of activation is performed by using fluorescent microscopy to observe the oligomerization of ASC in macrophage cells harboring an ASC-fluorescent protein reporter (Stutz et al., 2013). When using non-fluorescent macrophages, inflammasome formation can be observed by fixing, permeabilizing, and staining cells with an anti-NLRP3 or anti-ASC antibody. Importantly, the raw264.7 macrophage-like cell line does not harbor the ASC protein (Pelegrin et al., 2008), precluding analysis of inflammasome formation. By using microscopy approaches, it is possible to simultaneously analyze both the filamentation rate of the fungus and inflammasome formation, thus identifying the potential confounding factor of a morphogenesis defect.
Previous approaches have used propidium iodide (PI), a membrane impermeable dye, as a marker of macrophage pyroptotic cell death (O’Meara et al., 2018, 2015; Uwamahoro et al., 2014). Although this is a rapid and inexpensive method for monitoring cell death, staining with PI requires live cell imaging, which can make it challenging to image multiple infections at the same time points. Additionally, PI does not distinguish between pyroptosis and other forms of cell death that lead to a loss in membrane integrity. Similarly, lactate dehydrogenase (LDH) release can be used as a non-specific marker of cell death.
We suggest monitoring inflammasome activation after four hours of co-incubation. This timepoint was chosen to maximize the rate of ASC speck formation while also avoiding the secondary form of macrophage cell death (Uwamahoro et al., 2014; Tucey et al., 2018). We also include a protocol for determining the phagocytosis rates of various fungal strains. This is an important confounding factor, as macrophages that do not take up C. albicans cells will not be able to trigger the intracellular inflammasome response. Moreover, macrophages that more rapidly engulf C. albicans will be able to start the inflammasome activation kinetics earlier and may thus appear to have greater rates of inflammasome activation (O’Meara et al., 2018). Because measurement of priming and activation is based on macrophage parameters, this protocol is adaptable to screening inflammasome induction in response to fungal mutant libraries or panels of different fungal species or strains. The different fungal species may have different kinetics of phagocytosis or inflammasome activation; therefore, it will be important to perform time-course analyses with the wild type strains to determine the appropriate parameters for each species.
Critical Parameters & Troubleshooting:
While the methods outlined here provide a framework for achieving optimal results under the described test system, adjustments to parameters such as tissue culture well size, incubation times, multiplicity of infection, or growth media, as well as variability in assessing different fungal strains, may require minor alterations to ensure appropriate cell densities to maximize the quality of images. Microscopic equipment should be sufficient to provide the magnification and resolution required to accurately distinguish between signal and noise in identifying ASC oligomerization events and to determine the levels of filamentation of the various fungal strains. This may require optimization of exposure settings and microscopic focus.
Controlling for internalization is critical to assessing the degree to which fungal exposure is responsible for inflammasome activation. In this regard, ASC oligomerization events should only be enumerated from infected macrophages, and experiments should include macrophage-only controls. Furthermore, when comparing inflammasome activation in response to multiple fungal strains or species, interpretation is aided by data provided in Support Protocol 1 - Controlling for Phagocytosis. As strains with defects in filamentation often have defects in inflammasome activation, it is important to note the morphology of the fungi within macrophages after 4 hours of infection. Additionally, strains that are constitutively filamentous may demonstrate defects in engulfment by macrophages (Maxson et al., 2018), therefore it is important to note the morphology of the fungal strains early on during infection.
Culturing macrophages with antibiotics and antimycotics aids in aseptic preparation. However, during the infection stages of experimentation, RPMI media without antibiotics or antimycotics is used to preserve the live cell interaction between macrophages and fungi, allowing assessment of active fungal cellular processes that may contribute to macrophage inflammasome activation.
When comparing levels of inflammasome priming between fungal strains, it is crucial to use identical timepoints for collection. For this reason, staggering the timepoints for infection will allow for sufficient time to collect cell pellets. Additionally, quantification of priming relies on high-quality RNA obtained from the infections. Ideally, the nanodrop analysis will indicate an A260/A280 ratio between 1.8 and 2.0 and an A260/A230 ratio of higher than 1.5. Low A260/A280 ratios from the spectrophotometer can indicate low quality or quantities of RNA, and a low A260/A230 ratio indicates contamination. If the RNA is of insufficient quantity and quality, it should not be used for further analysis.
Technical variation during infection is minimized by performing synchronization of replicates and infections with different strains at two points. Centrifugation immediately following the addition of fungal cells to macrophages ensures that exposure between fungi and macrophage begins simultaneously across different infection wells. Formaldehyde fixation immediately following infection preserves the interaction of macrophage and fungi at a specified timepoint, allowing analysis of numerous infections thereafter without concern for temporal divergences.
Alternative methods to measure macrophage cell death include culturing in propidium iodide, a membrane impermeable dye used as an indicator of macrophage lysis at individual cell resolution, or measuring the release of lactate dehydrogenase from macrophages as a marker of compromised membrane integrity. While these methods may prove informative in demonstrating induction of macrophage cell death in response to C. albicans, measurement of ASC oligomerization offers the benefit of specifically indicating inflammasome activation. The use of fixatives in this protocol also makes measurement of ASC oligomerization amenable to processing numerous isolates and replicates, whereas fixatives may confound the results of propidium iodide or lactate dehydrogenase assays by artificially disrupting cell membranes.
The counting protocol for ASC specks or phagocytosis rates using ImageJ is manual, and is best suited for a limited number of strains. CellProfiler analysis software (Jones et al., 2008) can be used for more high-throughput analysis. When using CellProfiler to measure ASC specks, we recommend using the permeabilization and staining steps from support protocol 1 to ensure that only macrophages with internalized fungal cells are analyzed for speck formation. However, it is important to ensure that the calcofluor white excitation/emission spectrum does not interfere with the excitation/emission of the ASC-fluorescent protein.
Statistical Analysis:
When measuring inflammasome activation, the proportion of ASC positive macrophages is determined by dividing the number of infected macrophages exhibiting ASC speck formation by the total number of infected macrophages. Assessment of significant variation can be described with statistical comparisons between isolates and a control strain using one-way analysis of variance (ANOVA) with Dunnett’s multiple comparison test.
Measurement of inflammasome priming yields normalized expression levels of IL-1B and NLRP3 for each macrophage-yeast interaction as well as an uninfected macrophage control, and the normalization is to a macrophage housekeeping gene. The general approach to determining relative expression levels is the 2−ΔΔCT method. Significant variation can be assessed by comparisons of normalized expression between macrophages infected with different fungal strains and with the uninfected control using one-way ANOVA with Dunnett’s multiple comparison test.
Assessment of phagocytosis rates demonstrates the percentage of internalized fungal cells for each fungal isolate. The percent internalized can be compared between each isolate and a control strain using one-way ANOVA with Dunnett’s multiple comparison test.
Understanding Results:
Absolute rates of inflammasome activation and fungal internalization will vary from strain to strain. In this regard, results of mutant collections should be compared to wild-type strains from the parental genetic background. ASC oligomerization events can be expressed as the percentage of infected cells positive for ASC oligomerization. Inflammasome priming, as measured by qRT-PCR, and activation, as measured by ASC oligomerization events, that is statistically different from those of the wild type control strains will indicate biological differences that lead to increased or reduced induction of the inflammasome response.
Time Considerations:
Seeding macrophage monolayers and preparing Candida cultures for infection must be performed one day in advance of infection to allow for overnight incubation. Measuring inflammasome activation requires four hours of infection in addition to time considerations for inoculating with Candida cells and applying fixative following the interaction, which will scale with increased amounts of isolates being screened. Once fixed, samples can be maintained at 4°C until analysis. The time required for enumeration of ASC oligomerization events increases with the number of replicates and isolates tested. Three hours of infection are required prior to RNA extraction when measuring inflammasome priming. The cell pellets may be maintained at −80°C without loss of integrity. RNA extraction and cDNA synthesis are expedited in this method by utilization of kits. qRT-PCR times will vary by thermocycler, but will likely require approximately four hours for complete reaction.
Acknowledgements:
TRO is funded by KAI137299 (NIAID), DJS and FMA are supported by the Molecular Mechanisms in Microbial Pathogenesis Training Program (T32 AI007528).
References:
- Bauernfeind FG, Horvath G, Stutz A, Alnemri ES, MacDonald K, Speert D, Fernandes-Alnemri T, Wu J, Monks BG, Fitzgerald KA, et al. 2009. Cutting edge: NF-kappaB activating pattern recognition and cytokine receptors license NLRP3 inflammasome activation by regulating NLRP3 expression. Journal of immunology 183:787–791. [DOI] [PMC free article] [PubMed] [Google Scholar]
- Drummond RA, Gaffen SL, Hise AG, and Brown GD 2014. Innate defense against fungal pathogens. Cold Spring Harbor perspectives in medicine 5. [DOI] [PMC free article] [PubMed] [Google Scholar]
- Hise AG, Tomalka J, Ganesan S, Patel K, Hall BA, Brown GD, and Fitzgerald KA 2009. An essential role for the NLRP3 inflammasome in host defense against the human fungal pathogen Candida albicans. Cell host & microbe 5:487–497. [DOI] [PMC free article] [PubMed] [Google Scholar]
- Jones TR, Kang IH, Wheeler DB, Lindquist RA, Papallo A, Sabatini DM, Golland P, and Carpenter AE 2008. CellProfiler Analyst: data exploration and analysis software for complex image-based screens. BMC bioinformatics 9:482. [DOI] [PMC free article] [PubMed] [Google Scholar]
- Krysan DJ, Sutterwala FS, and Wellington M 2014. Catching fire: Candida albicans, macrophages, and pyroptosis. PLoS pathogens 10:e1004139. [DOI] [PMC free article] [PubMed] [Google Scholar]
- Liu X, Zhang Z, Ruan J, Pan Y, Magupalli VG, Wu H, and Lieberman J 2016. Inflammasome-activated gasdermin D causes pyroptosis by forming membrane pores. Nature 535:153–158. [DOI] [PMC free article] [PubMed] [Google Scholar]
- Maxson ME, Naj X, O’Meara TR, Plumb JD, Cowen LE, and Grinstein S 2018. Integrin-based diffusion barrier separates membrane domains enabling the formation of microbiostatic frustrated phagosomes. eLife 7. [DOI] [PMC free article] [PubMed] [Google Scholar]
- O’Meara TR, Duah K, Guo CX, Maxson ME, Gaudet RG, Koselny K, Wellington M, Powers ME, MacAlpine J, O’Meara MJ, et al. 2018. High-throughput screening identifies genes required for Candida albicans induction of macrophage pyroptosis. mBio 9:a019620. [DOI] [PMC free article] [PubMed] [Google Scholar]
- O’Meara TR, Veri AO, Ketela T, Jiang B, Roemer T, and Cowen LE 2015. Global analysis of fungal morphology exposes mechanisms of host cell escape. Nature communications 6:6741. [DOI] [PMC free article] [PubMed] [Google Scholar]
- Pelegrin P, Barroso-Gutierrez C, and Surprenant A 2008. P2X7 receptor differentially couples to distinct release pathways for IL-1beta in mouse macrophage. Journal of immunology 180:7147–7157. [DOI] [PubMed] [Google Scholar]
- Schneider CA, Rasband WS, and Eliceiri KW 2012. NIH Image to ImageJ: 25 years of image analysis. Nature methods 9:671–675. [DOI] [PMC free article] [PubMed] [Google Scholar]
- Stutz A, Horvath GL, Monks BG, and Latz E 2013. ASC speck formation as a readout for inflammasome activation. Methods in molecular biology 1040:91–101. [DOI] [PubMed] [Google Scholar]
- Swanson KV, Deng M, and Ting JP-Y 2019. The NLRP3 inflammasome: molecular activation and regulation to therapeutics. Nature reviews. Immunology 19:477–489. [DOI] [PMC free article] [PubMed] [Google Scholar]
- Tavares AH, Bürgel PH, and Bocca AL 2015. Turning up the heat: inflammasome activation by fungal pathogens. PLoS pathogens 11:e1004948. [DOI] [PMC free article] [PubMed] [Google Scholar]
- Tucey TM, Verma J, Harrison PF, Snelgrove SL, Lo TL, Scherer AK, Barugahare AA, Powell DR, Wheeler RT, Hickey MJ, et al. 2018. Glucose homeostasis is important for immune cell viability during candida challenge and host survival of systemic fungal infection. Cell metabolism 27:988–1006.e7. [DOI] [PMC free article] [PubMed] [Google Scholar]
- Uwamahoro N, Verma-Gaur J, Shen H-H, Qu Y, Lewis R, Lu J, Bambery K, Masters SL, Vince JE, Naderer T, et al. 2014. The pathogen Candida albicans hijacks pyroptosis for escape from macrophages. mBio 5:e00003–14. [DOI] [PMC free article] [PubMed] [Google Scholar]
- Wellington M, Koselny K, Sutterwala FS, and Krysan DJ 2014. Candida albicans triggers NLRP3-mediated pyroptosis in macrophages. Eukaryotic cell 13:329–340. [DOI] [PMC free article] [PubMed] [Google Scholar]
- Xie JL, Grahl N, Sless T, Leach MD, Kim SH, Hogan DA, Robbins N, and Cowen LE 2016. Signaling through Lrg1, Rho1 and Pkc1 governs Candida albicans morphogenesis in response to diverse cues. PLoS genetics 12:e1006405. [DOI] [PMC free article] [PubMed] [Google Scholar]