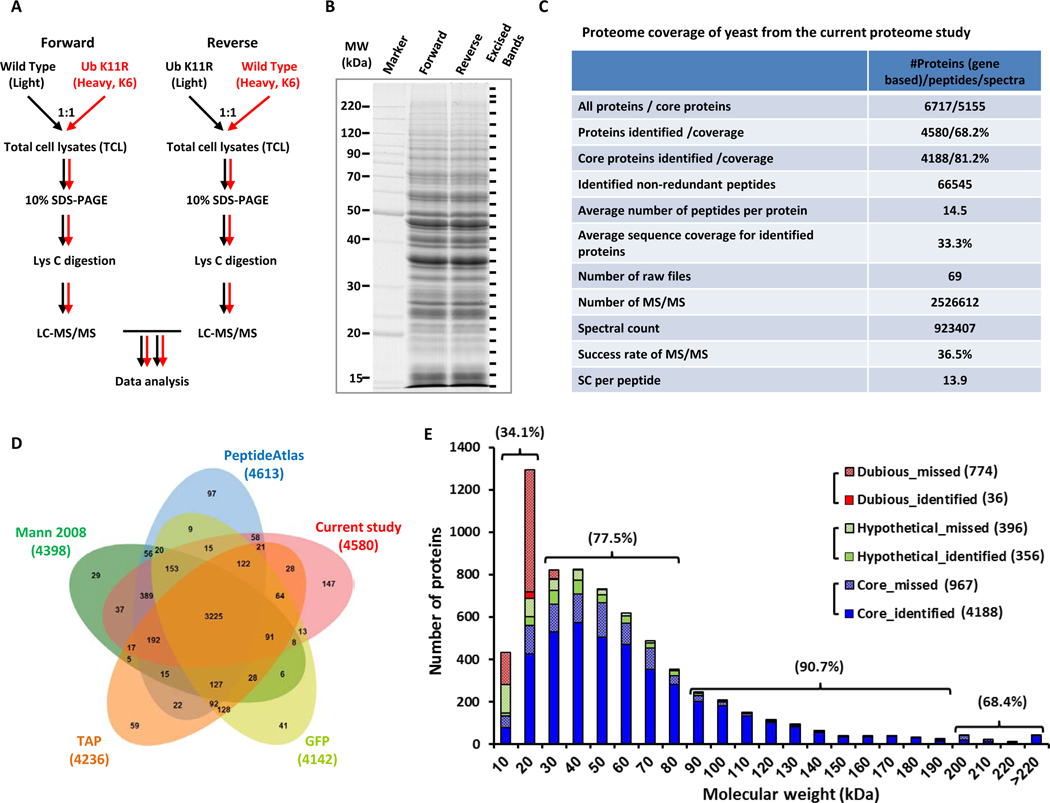
Figure 1. SILAC-based proteomic profiling of WT and ubiquitin K11R mutant yeast.
(A) Outline of label-swap experiments for comparing WT and K11R TCL samples.
(B) Sampling the yeast proteome by LC–MS/MS.
(C) Proteome coverage of current study.
(E) Proteome coverage of current study in comparison to previous studies.
(F) MW distribution of missed and identified proteins. The percentage represents the coverage of core proteins for the indicated MW range.

