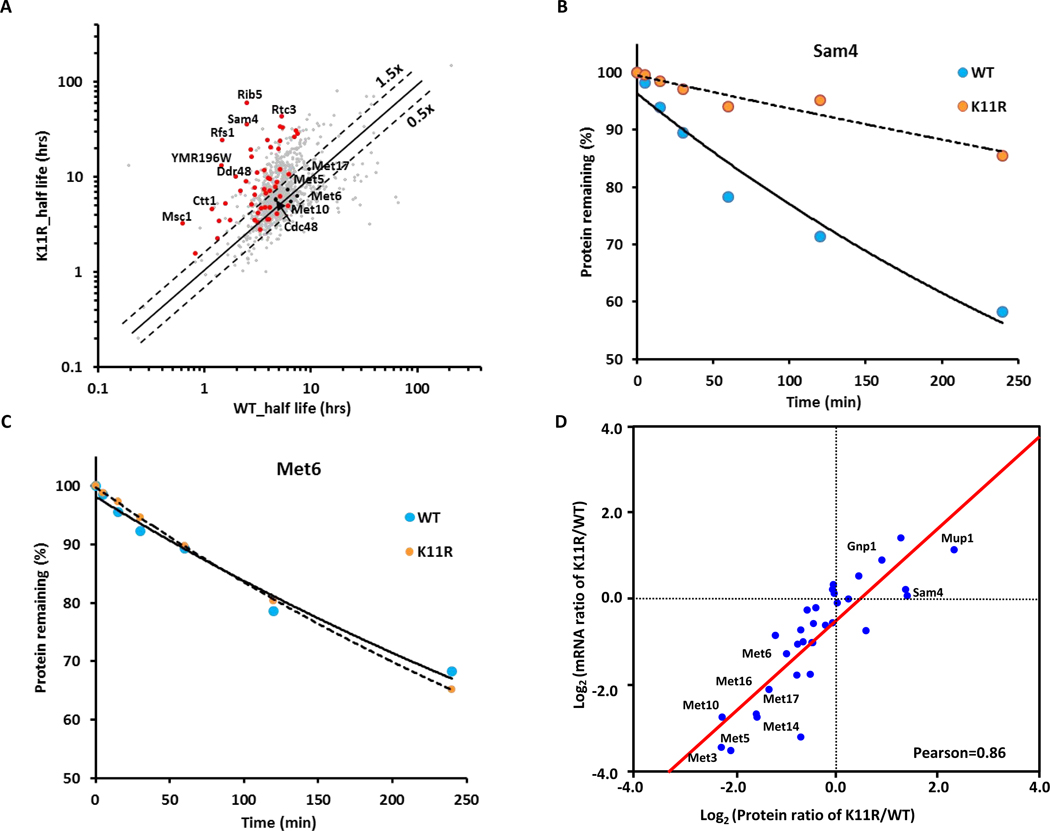
Figure 3. Members of the methionine biosynthesis pathway are regulated by K11-linked ubiquitin chains independent of protein stability.
(A) Global half-life analysis of proteomes of WT and ubiquitin K11R strains. Scatterplot comparing the half-life of whole proteome (n = 1,375, grey points) with proteins showing increased abundance in K11R mutants (upper right quadrant Figure 2A; i.e. potential K11 modified proteasome substrates) (n = 69, red points) are displayed.
(B and C) Decay curves for Sam4 (B) and Met6 (C), respectively.
(D) Correlations between the proteome and transcriptome. The Pearson correlation coefficient was 0.86.

