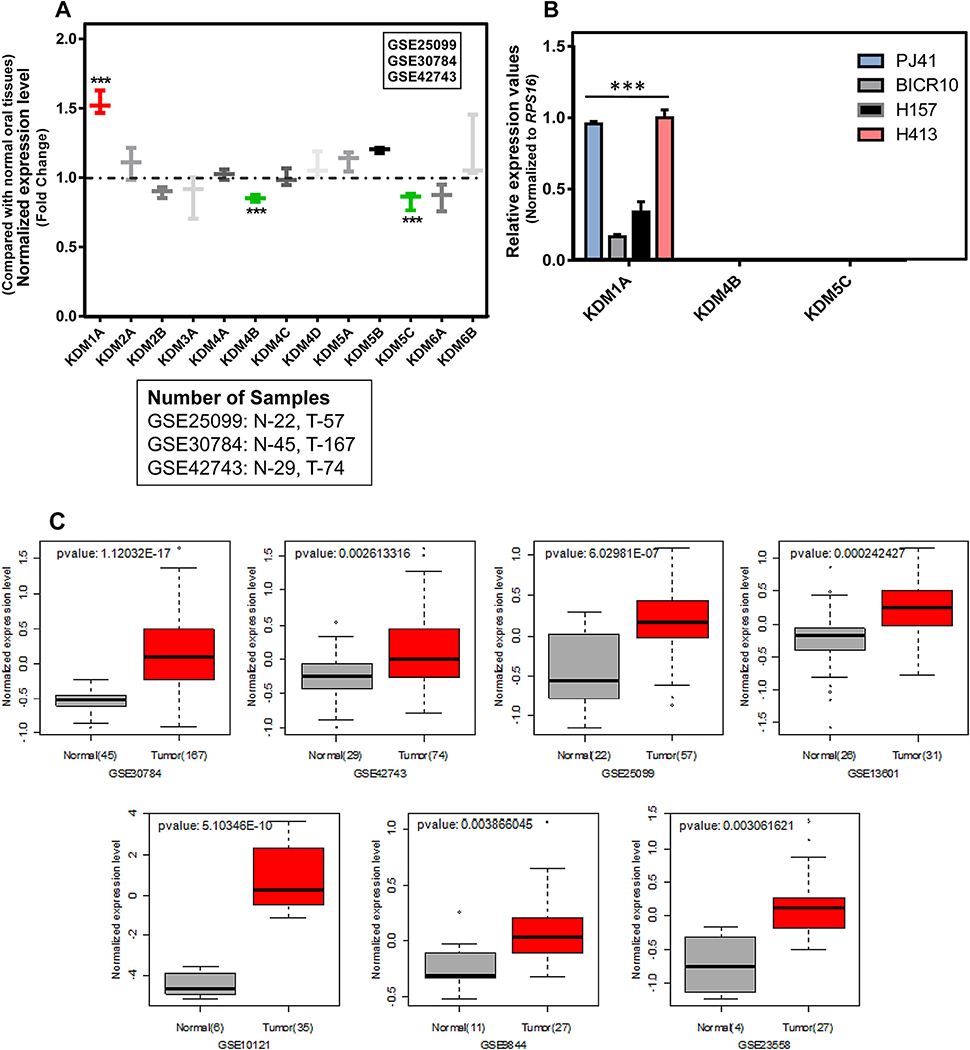
Fig. 1.
(A) KDM/JMJD gene expression pattern in normal and oral tumor tissue gene expression profiles. Graph shows that KDM1A expression is elevated in oral tumors compared to normal oral tissues in three independent cohorts of gene expression profiles. In contrast, under expression of KDM4B and KDM5C genes was observed in the same gene expression profiles. (B) KDM1A, KDM4B and KDM5C expression pattern in a panel of oral cancer cell lines. RT-PCR results show that only KDM1A expression was detected in oral cancer cell lines compared to KDM4B and KDM5C genes. (C) Expression pattern of KDM1A gene in independent cohorts of oral tumor gene expression profiles. Box plot shows the elevated KDM1A expression in oral tumors compared to normal oral tissues.

