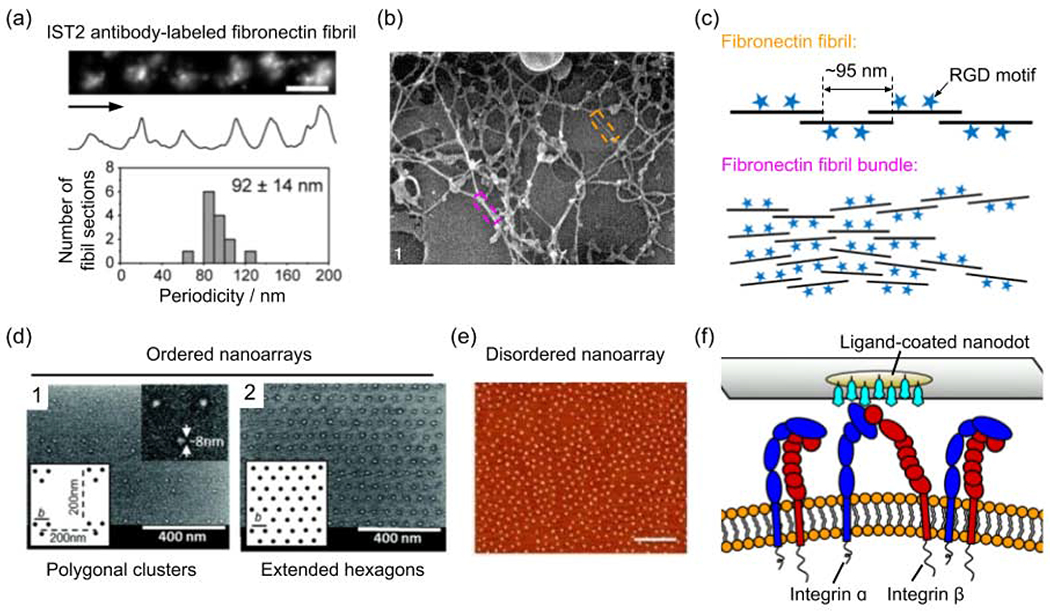
Figure 1.

The nanotopography of integrin-binding motifs. (a) The fibronectin molecules in the fibril are distributed periodically as shown by antibody IST2 immunostaining. (b) High-resolution cryo-scanning electron microscopy (SEM) image of fibronectin fibril network formed in human skin fibroblast cultures. Horizontal field width = 1.6 μm[112]. (c) Schematic presentation showing the spatial distribution of RGD motifs in fibronectin-based ECM. (d) SEM images of ordered ligand nanodot arrays that are arranged as polygonal (triangle shown in the representative image 1) clusters and extended hexagons (image 2)[45]. (e) Atomic force microscopy (AFM) image of disordered ligand nanodot array with an average interparticle distance of ~92 nm. Scale bars: 400 nm[44]. (f) Schematic presentation showing the steric hindrance between integrins for binding the ligands coated on nanodots. (a) is adapted with permission from [37], Springer Nature. (b) is adapted with permission from [112], Wiley. (d) is adapted with permission from [45], American Chemical Society. (e) is adapted with permission from [44], American Chemical Society.
