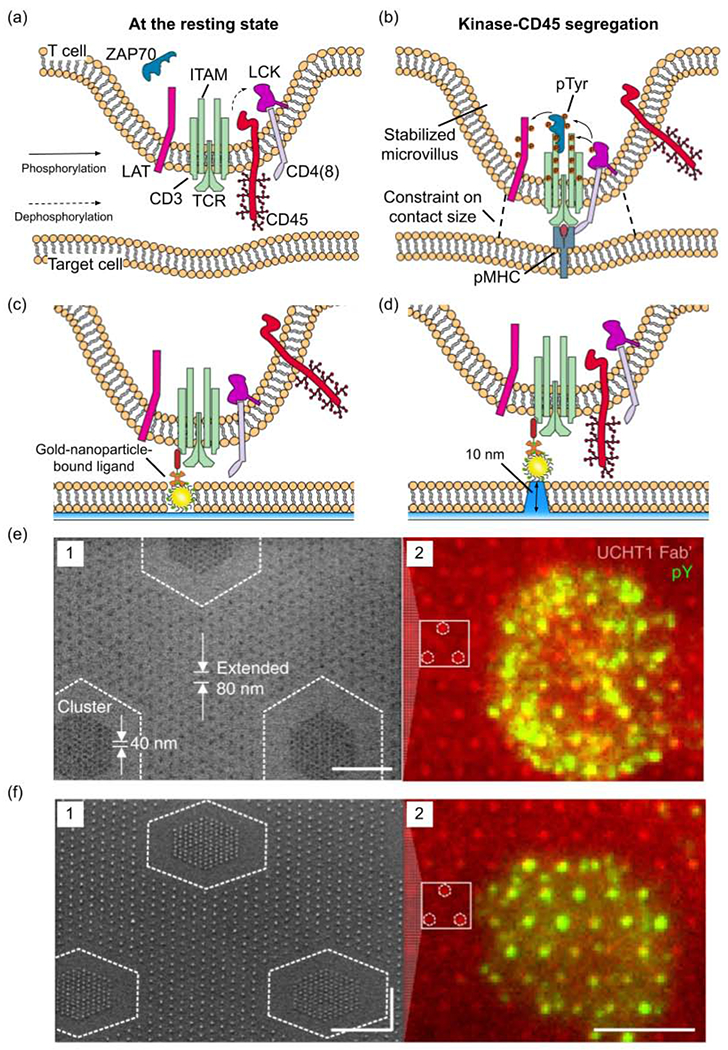
Figure 3.

The effects of ligand nanotopography on TCR triggering. (a) Schematic presentation showing the T cell at its resting state before TCR binding to the pMHC ligand. (b) Schematic presentation showing T cell activation and kinase-CD45 segregation from the contact site. (c,d) Schematic presentations showing the TCR triggering by nanofabricated patterns of anti-CD3 antibody-bond gold nanoparticles. The nanoparticles are embedded in a flat lipid bilayer surface (c) or lifted by 10-nm high glass pedestals (d). (e,f) SEM images of anti-CD3 antibody-bond gold nanoparticle arrays (image 1 of each figure, scale bars: 500 nm) on the flat surface (e) or lifted by 10 nm on glass pedestals (f). The nanoparticles are distributed as 40 nm clusters embedded in an 80 nm extended array. The image 2 of each figure shows the TCR triggering indicated by the immunofluorescence signal of phosphorylated tyrosine (green) on anti-CD3 antibody (red)-bond gold nanoparticle arrays, scale bar, 5 μm. (c-f) are adapted with permission from [57], Springer Nature.
