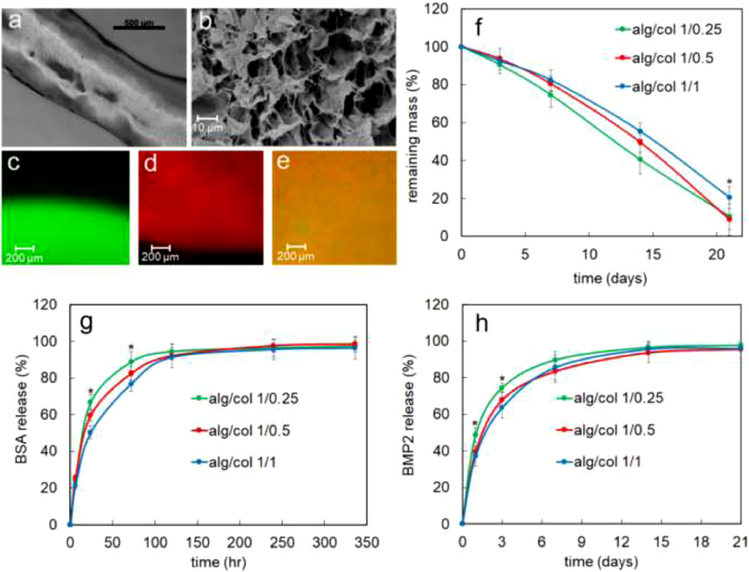
Figure 3.
(a) alg/col 1/0.5 gel strut injected from a 20G needle (b) A representative SEM image of alg/col 1/0.5 hydrogel (c) fluorescent image of alg/col alg (without collagen) prepared with green fluorescent-labeled alginate (d) fluorescent image of col hydrogel (without alginate) stained with red fluorescent dye (e) fluorescent image of alg/col 1/0.5 hydrogel that was prepared with green fluorescent-labeled alginate and then stained with red fluorescent dye to visualize collagen (f) degradation kinetics of alg/col 1/0.25 (green), alg/col 1/0.5 (red), and alg/col 1/1 (blue) hydrogels in PBS supplemented with collagenase and sodium citrate at 37°C. (g) release kinetics of BSA from alg/col 1/0.25 (green), alg/col 1/0.5 (red), and alg/col 1/1 (blue) hydrogels. (h) release kinetics of BMP2 from alg/col 1/0.25 (green), alg/col 1/0.5 (red), and alg/col 1/1 (blue) hydrogels. Error bars in 3f-3h correspond to means ±1 SD for n = 3. “An asterisk” in 3f, 3g, and 3h represents a statistically significant difference between the test group and all other groups at that time point.

