Figure 4.
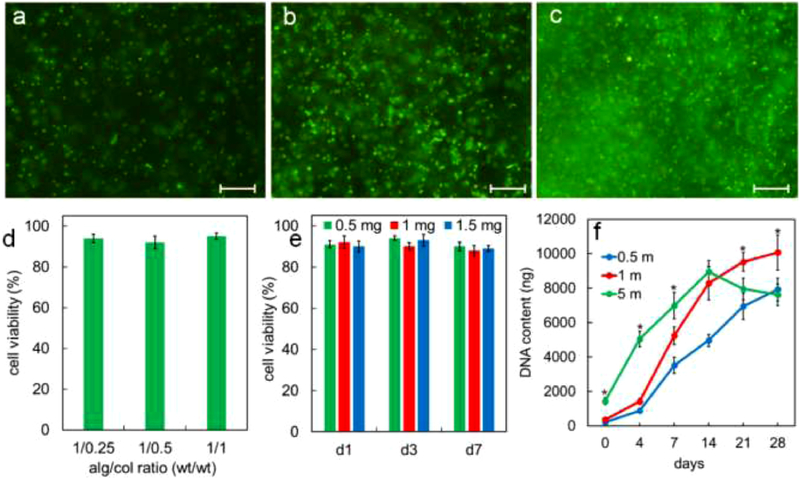
live (green) and dead (orange) hMSCs encapsulated in alg/col 1/0.5 hydrogel with 0.5 million cells/mL (a), 1 million cells/mL (b) and 5 million cells/mL (c) cell densities 24hr after encapsulation. (d) effect of alginate to collagen weight ratio on the viability of hMSCs encapsulated in alg/col hydrogel with 1 million cells/mL density 24hr after encapsulation. (e) effect of CaSO4 concentration in alg/col 1/0.5 hydrogels on the viability of encapsulated hMSCs (f) DNA content of hMSC-laden alg/col 1/0.5 hydrogels with cell densities of 0.5, 1 and 5 million cells/mL incubated in basal medium over 28 days. Scale bars in 4a-c are 100 μm. Error bars correspond to means ±1 SD for n = 3. “An asterisk” in 4f represents a significantly higher DNA content in the test group compared with all other groups at that time point.

