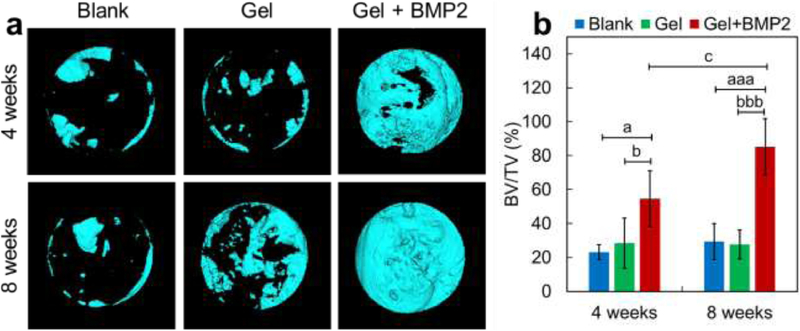
Figure 6.
(a,b) representative micro-CT reconstructed 3D images and the quantitative result of regenerated bone in the calvarial defect site. (a) 3D images of new bone formation in calvarial defect site without hydrogel injection (Blank) or with injection of alg/col 1/0.5 hydrogel alone (Gel) or BMP2-loaded alg/col 1/0.5 hydrogel (Gel + BMP2) after 4 weeks or 8 weeks. (b) Quantitative bone volume fraction (BV/TV) in calvarial defect site. Data are shown as mean ± SD (n = 6 per time point per group). aP < 0.05, aaP < 0.01, aaaP < 0.001, vs. Blank group; bP < 0.05, bbP < 0.01, bbbP < 0.001, vs. Gel group; cP < 0.05, vs. Gel + BMP2 (4 weeks).

