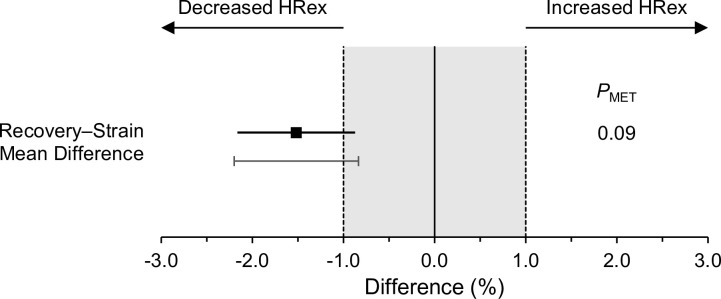
Fig 7. Short-term effect in exercise heart rate (HRex).
Plot displays mean difference between recovered and strained state with 90% confidence interval (black square with error bars), as well as interindividual response variability around the mean effect (i.e., ± interindividual SD, gray vertical line with caps). PMET: P value for minimum effect test against a minimum practically important difference of 1% [1].

