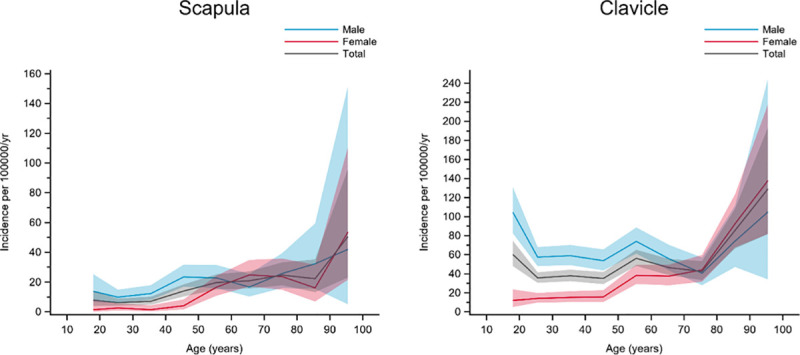
Fig 5. Fractures in group D.

Age- and gender-specific incidence with 95% confidence interval. Black line represents the total population; red line represents females and blue line represents males.

Age- and gender-specific incidence with 95% confidence interval. Black line represents the total population; red line represents females and blue line represents males.