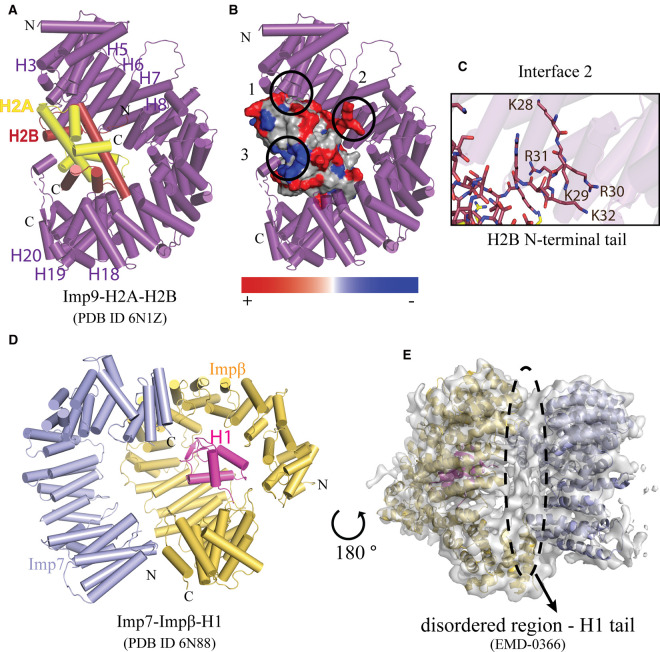
Figure 4. Structures of H2A–H2B and H1 nuclear import complexes.
(A) Imp9 (purple, helices shown as cylinders) bound to the H2A–H2B dimer (yellow-red, helices shown as cylinders; PDB ID: 6N1Z) (B) Charged residues at the interfaces of the Imp9•H2A–H2B complex (surface representation) with basic residues in red and acidic residues in blue. (C) 5 residues (28–32) in the N-terminal tail of H2B contact Imp9. (D) Imp7 (light blue, helices shown as cylinders) and Impβ (yellow) bound to linker histone H1 (magenta; PDB ID 6N88). (E) Cryo-EM map (gray) showing the density between Imp7 and Impβ, which cannot be modeled but possibly correspond to the disordered C-terminal tail of linker-histone H1 (EMD-0366).

