
FIGURE 1.
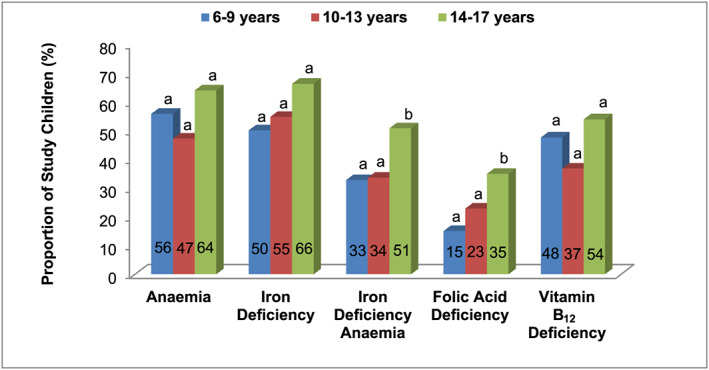
Prevalence of anaemia, iron deficiency, iron deficiency anaemia, folic acid deficiency and vitamin B12 deficiency among different age groups. The proportions between age groups were compared by Chi square test. The bars that do not share common superscript differ significantly (P < .05)