FIGURE 2.

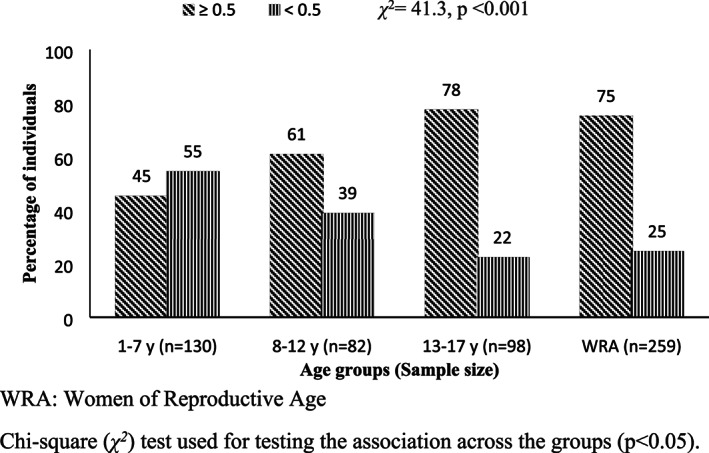
Distribution of individuals based on micronutrient inadequacy (mean probability of adequacy <0.5) χ 2 = 41.3, p < 0.001. WRA, women of reproductive age. χ 2 test used for testing the association across the groups (p < 0.05)

Distribution of individuals based on micronutrient inadequacy (mean probability of adequacy <0.5) χ 2 = 41.3, p < 0.001. WRA, women of reproductive age. χ 2 test used for testing the association across the groups (p < 0.05)