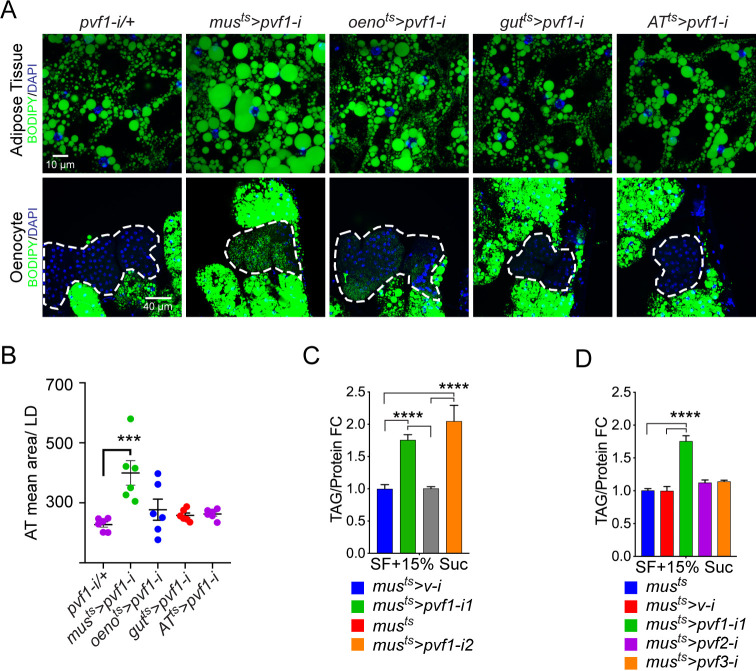
Figure 1. A muscle-to-oenocyte Pvf1 signaling axis protects against obesity.
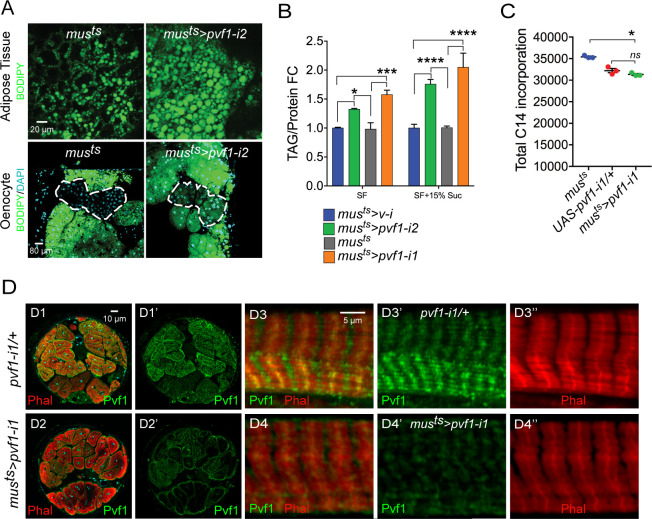
(A) BODIPY staining showing neutral lipid accumulation in the adult male adipose tissue (AT) and oenocytes (dorsal abdominal cuticle) of flies in which pvf1 was knocked down using an RNAi transgene (VDRC: kk102699) specifically in the adult: muscle (musts= muscle-Gal4Gal80ts), oenocytes (oenots = oenocyte-Gal4Gal80ts), gut (gutts = gut-Gal4Gal80ts), and adipose tissue (ATts = AdiposeTissue-Gal4Gal80ts). The RNAi transgene alone is shown as a control. Similar results were observed using a different RNAi line (NIG: 7103 R-2, data not shown). (B) Mean lipid droplet size (≥10 microns in diameter) in the adipose tissue of flies shown in (A). Only muscle-specific loss of pvf1 show a significant increase compared to the control genotype, N = 6 animals, One-way ANOVA followed by Tukey’s HSD test, *** denotes p≤0.001, error bars = SEM. (C) Triacylglycerol (TAG) assay showing TAG/protein ratio in adult males in which pvf1 was knocked down specifically in the muscle. Knocking down pvf1 using two independent RNAi lines (pvf1-i1::VDRC kk102699 and pvf1-i2::NIG 7103 R-2) leads to a significant increase in total TAG content of the flies. (musts>v-i = muscle-Gal4Gal80ts>vermilion RNAi). (SF+15% Suc = standard lab food supplemented with 15% sucrose w/w). N = 6, Cohorts of eight males were used for each data point. One-way ANOVA followed by Tukey’s HSD test, **** denotes p≤0.0001, error bars = SEM. (D) Total TAG content of adult males with adult muscle-specific (musts) knockdown of pvf1, pvf2 and pvf3. N = 6, Cohorts of eight males were used for each data point. One-way ANOVA followed by Tukey’s HSD test, **** denotes p≤0.0001, error bars = SEM.


