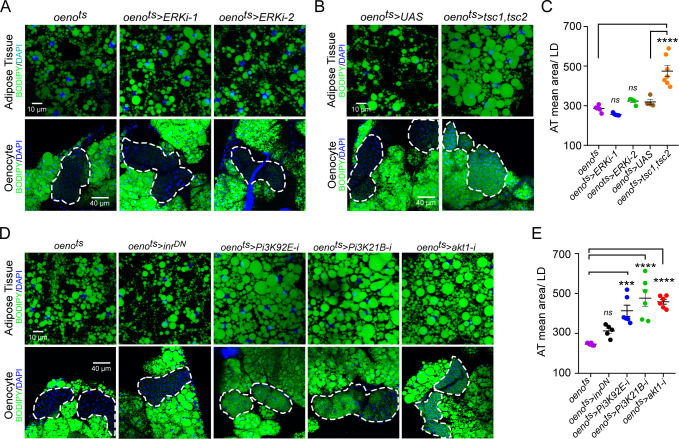
Figure 3. Oenocyte-specific Pi3K/Akt1/TOR signaling protects against obesity.
(A) BODIPY staining showing neutral lipid accumulation in the adipose tissue and oenocytes of control males (oenots = oenocyte-Gal4Gal80ts) and males with oenocyte-specific knockdown of ERK (oenots>ERKi-1 and oenots>ERKi-2) using two independent RNAi lines. (B) BODIPY staining showing neutral lipid accumulation in the adipose tissue and oenocytes of control males (oenots) and males with oenocyte-specific over-expression of tsc1 and tsc2 (oenots>tsc1,tsc2). (C) Mean lipid droplet size (≥10 microns in diameter) in the adipose tissue of flies shown in Figure 2A and B. Only oenocyte-specific loss of TOR signaling (oenots>tsc1,tsc2) show a significant increase (p<0.001) compared to the control genotype. N = 6 animals, One-way ANOVA followed by Tukey’s HSD test, **** denotes p≤0.0001, error bars = SEM. (D) BODIPY staining showing neutral lipid accumulation in the adipose tissue and oenocytes of control males (oenots) and males with oenocyte-specific over-expression of inrDN (oenots>inrDN) and oenocyte-specific (oenots>) knockdown of Pi3K92E (Dp110), Pi3K21B (Dp60) and akt1. (E) Mean lipid droplet size (≥10 microns in diameter) in the adipose tissue of flies shown in Figure 2D. Oenocyte-specific (oenots>) knockdown of Pi3K92E (Dp110), Pi3K21B (Dp60), and akt1 lead to a significant increase (p<0.001 for Pi3K92E, and, p<0.0001 for Pi3K21B and akt1) compared to the control genotype. N = 6 animals, One-way ANOVA followed by Tukey’s HSD test, *** denotes p≤0.001, **** denotes p≤0.0001, error bars = SEM.


