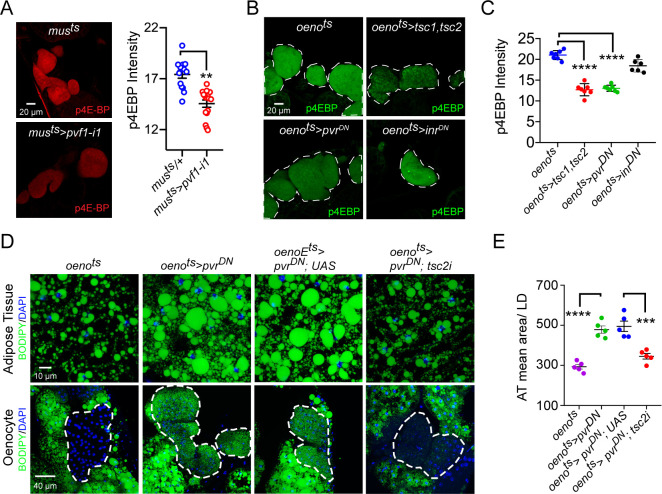
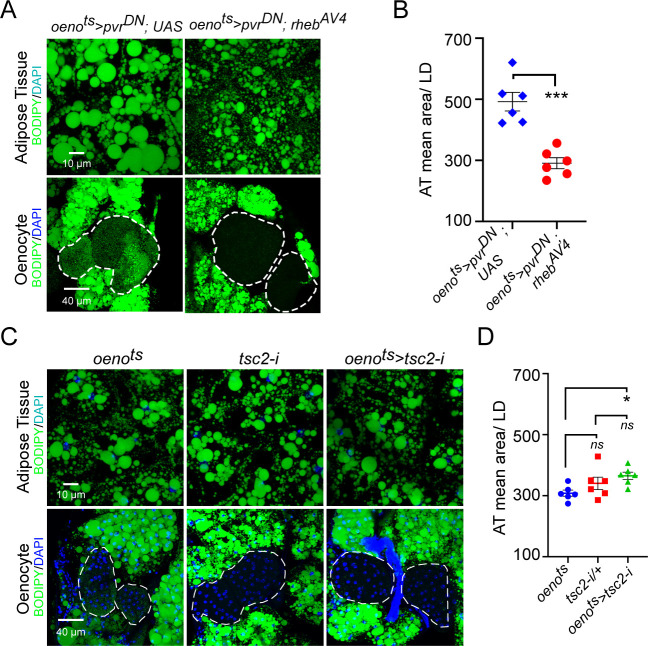
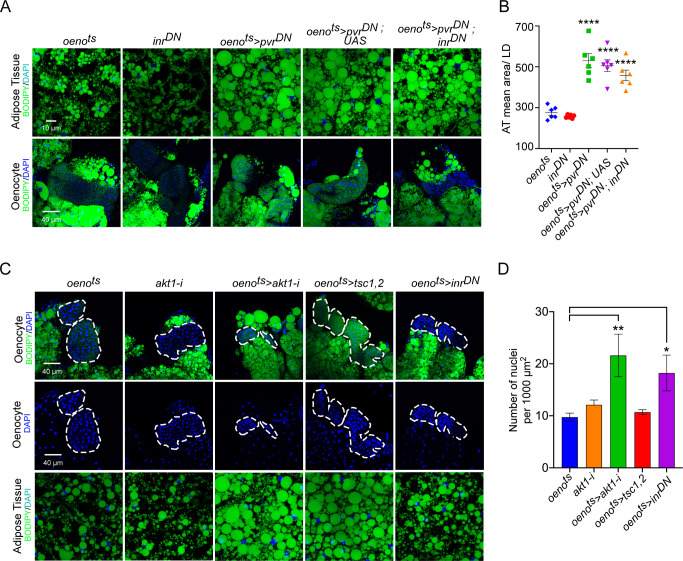
Figure 4. Pi3K/Akt1/TOR signaling acts downstream of PvR in the oenocytes to regulate adiposity.
(A) p4EBP staining (Red) of the oenocytes from control (musts = muscle-Gal4Gal80ts) and flies with muscle-specific knockdown of pvf1 (musts>pvf1-i1). Muscle-specific loss of pvf1 leads to a significant decrease (p<0.01) in p4EBP levels in the oenocytes. N = 10 animals, student t-test, ** denotes p≤0.01, error bars = SEM. (B) p4EBP staining (Green) of oenocytes from control flies (oenots = oenocyte-Gal4Gal80ts) and flies with oenocyte-specific over-expressing tsc1/tsc2 (oenots>tsc1,tsc2), pvrDN (oenots>pvrDN) or inrDN (oenots>inrDN). (C) Quantification of p4EBP staining intensity in the oenocytes for samples shown in Figure 3C. Oenocyte-specific over-expression of tsc1/tsc2 (oenots>tsc1,tsc2) and pvrDN (oenots>pvrDN) led to a significant reduction in p4EBP levels (p<0.0001). Over-expression of inrDN (oenots>inrDN), however, does not affect p4EBP levels significantly. N = 6/7 animals, Student t-test, **** denotes p≤0.0001, error bars = SEM. (D) BODIPY staining showing neutral lipid accumulation in the adipose tissue and oenocytes of control males (oenots) and males with oenocyte-specific over-expression of either pvrDN (oenots>pvrDN) or over-expression of pvrDN along with tsc2 knockdown (oenots>pvrDN,tsc2-i). Flies over-expressing pvrDN in the oenocytes along with an empty UAS construct (oenots>pvrDN,UAS) serve as an additional control to account for any effect of Gal4 dilution on the obesity phenotype. (E) Mean lipid droplet size (≥10 microns in diameter) in the adipose tissue of flies shown in (D). Oenocyte-specific knockdown of tsc2 along with pvrDN over-expression (oenots>pvrDN,tsc2-i) significantly rescues the obesity phenotype observed flies with oenocyte-specific over-expression of pvrDN (p<0.001). N = 5 animals, One-way ANOVA followed by Tukey’s HSD test, *** denotes p≤0.001, **** denotes p≤0.0001, error bars = SEM.


