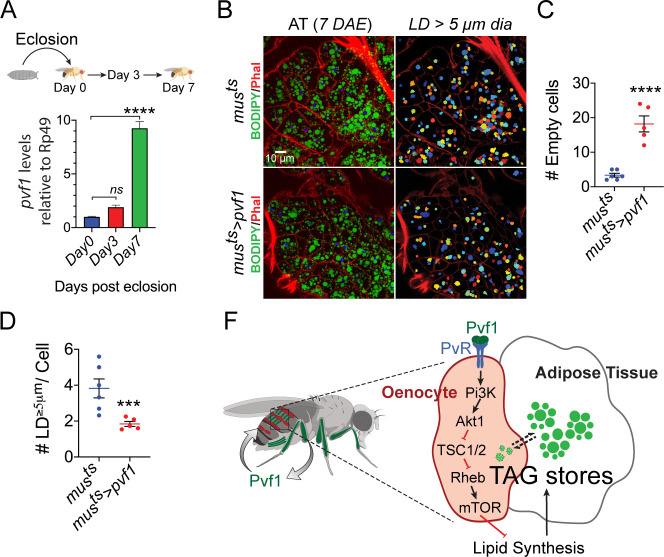
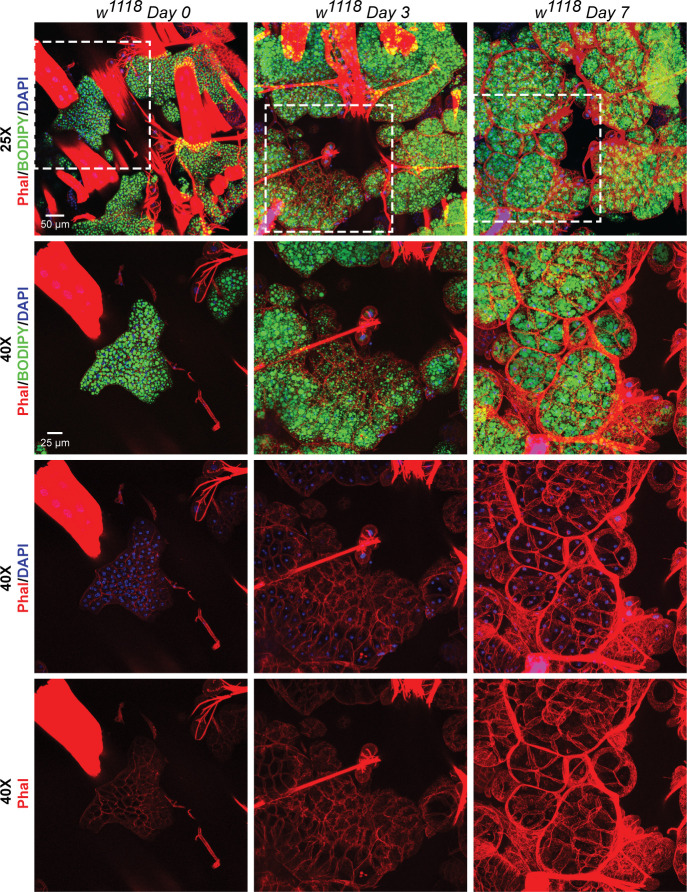
Figure 6. Muscle-Pvf1 limits post-eclosion lipid recovery by suppressing lipid synthesis.
(A) Muscle-specific expression of pvf1 in freshly eclosed w1118 males on days 0, 3 and 7 post eclosion. N = 4, 10 adult male abdominal cuticles were used per data point. One-way Anova followed by Dunnett multiple comparison test, ns denotes Not Significant with p=0.202, **** denotes p≤0.0001, error bars = SEM. (B) BODIPY staining of adipose tissue from 7-day-old control males (musts = muscle-Gal4Gal80ts) and males with muscle-specific over-expression of pvf1 (musts>Pvf1) from Day 0 of eclosion. Panels on the right show identification of lipid droplets (LD) that are ≥ 5 μm in diameter using Cell Profiler. DAE = days after eclosion. (C) Quantification of number of adipose tissue cells that do not contain LDs that are ≥ 5 µm in diameter for control (musts) flies and flies with muscle-specific over-expression of pvf1 (musts>pvf1). N = 5/6 animals, Student t-test, **** denotes p≤0.0001, error bars = SEM. (D) Quantification of number of large (≥5 μm in diameter) LDs per cell in control (musts) flies and flies with muscle-specific over-expression of pvf1 (musts>pvf1). N = 5/6 animals, Student t-test, *** denotes p≤0.001, error bars = SEM. (E) Model of the role of muscle-derived Pvf1 in regulating systemic lipid content by signaling to the oenocytes of adult male flies.


