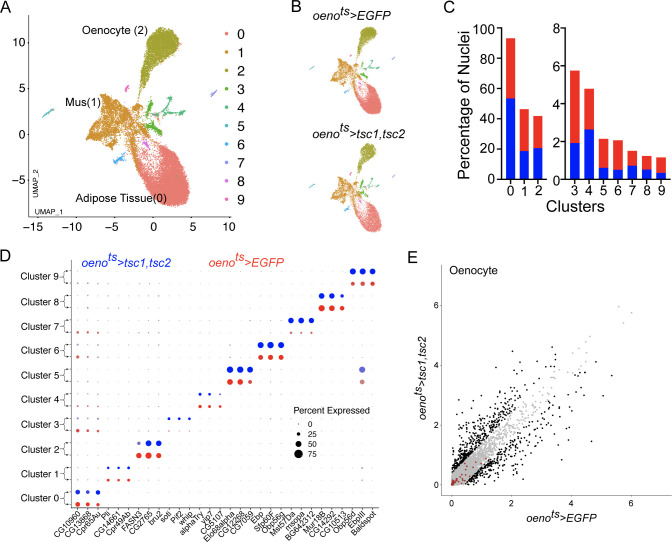
Figure 7. Differential snRNA-seq of the abdominal cuticle upon oenocyte-specific loss of TOR.
(A) Integrated Uniform Manifold Approximation and Projection (UMAP) plot of snRNA-seq data derived from the abdominal cuticle samples pertaining to oenocyte-specific overexpression of tuberous sclerosis complex 1 and 2 (tsc1, tsc2), which results in the blockade of TOR activity. The UMAP shows 10 distinct clusters (0–9) with the Adipose (0), Muscle (1), and Oenocytes (2) as the major tissue clusters. oenots = oenocyte-Gal4Gal80ts. (B) UMAPs separated (from A) based on samples oenocyte-specific overexpression of EGFP control (oenots>EGFP) and tsc1, tsc2 (oenots>tsc1, tsc2). (C) Bar graphs depicting the percentages of nuclei between the two genotypes oenots >EGFP (red) and oenots>tsc1, tsc2 (blue). Note that the fraction of nuclei did not change in cluster 2, which represents the Oenocytes. (D) Dot plot representing top three genes enriched per cluster based on average expression (logFC). Color gradient of the dot represents the expression level, while the size represents percentage of cells expressing any gene per cluster. The dots within each cluster are separated based on the two genotypes oenots>EGFP (red) and oenots>tsc1, tsc2 (blue) to showcase changes in gene expression, if any. (E) Scatter plot depicting the differentially expressed genes within the Oenocyte cluster pertaining to the two genotypes, oenots>EGFP and oenots>tsc1,tsc2 [log(average expression +1)]. The differential gene expression analysis reveals that certain genes known to be induced upon starvation (highlighted as red dots) remain unchanged upon loss of TOR activity within oenocytes compared to controls. See Supplementary file 4 for the list of starvation-induced genes.

