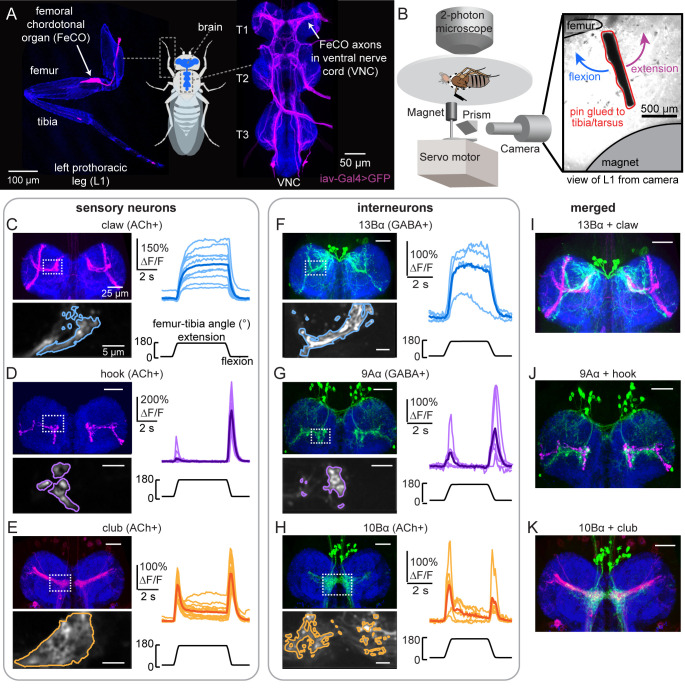
Figure 1. Transformation of leg proprioceptive signals from sensory to central neurons.
(A) Left: Confocal image of the prothoracic (front) leg showing the location of the femoral chordotonal organ (FeCO) cell bodies and dendrites (magenta). Blue: cuticle auto-fluorescence. Right: confocal image of FeCO neurons in the fly ventral nerve cord (VNC). Blue: neuropil stain (nc82); Magenta: FeCO axons. (B) Experimental setup for two-photon calcium imaging from VNC neurons while controlling and tracking the femur-tibia joint. A steel pin was glued to the tibia, painted black, and moved via a magnet mounted on a servo motor. The tibia was vibrated by a piezoelectric crystal fixed to the magnet. Right: an example frame from a video used to track joint angle. (C–H) Calcium signals from FeCO sensory neurons or central neurons in response to swing movements of the femur-tibia joint. Top left: anatomy (magenta or green) of each cell type in the prothoracic VNC (blue: nc82). The dashed white box indicates the recording region. Bottom left: GCaMP6f fluorescence within the recording region during an example trial. The pixels comprising each region of interest are outlined. Right: changes in GCaMP6f fluorescence (ΔF/F) during femur-tibia swing movements. The thicker line is the response average (n=10, 13, 14, 4, 6, 6). (I–K) Overlay of sensory axons (magenta) and central neurons (green). Data in C–E were reproduced with permission from Mamiya et al., 2018. All VNC images were aligned using the Computational Morphometry Toolkit (Jefferis et al., 2007).


