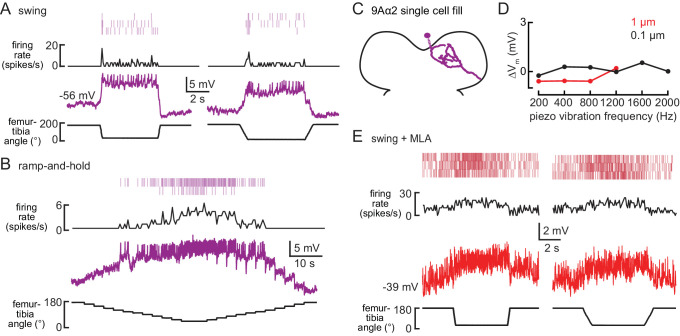
Figure 5. 9Aα neurons encode high frequency tibia vibration.
(A and B) Example whole-cell current clamp recordings from two 9Aα cells during a 0.1 μm tibia vibration. The shaded region indicates the duration of the vibration stimulus. (C) The change in membrane potential during the first 500 ms of vibration across amplitudes and frequencies. Each point is the averaged response of a cell to three stimulus presentations (from left to right, n = 10, 15, 16). (D and E) The change in membrane potential during the first 500 ms after vibration onset before (purple) and after (red) application of an antagonist of nicotinic acetylcholine receptors, MLA (1 μM, D), or before (purple) and after (red) application of the GABA a and GluCl antagonist, picrotoxin (100 μM, E). The inset in E shows the resting membrane potential before (purple) and after (red) application of picrotoxin. Picrotoxin application depolarized the membrane potential in the majority of cells (n = 7).


