
FIGURE 1.
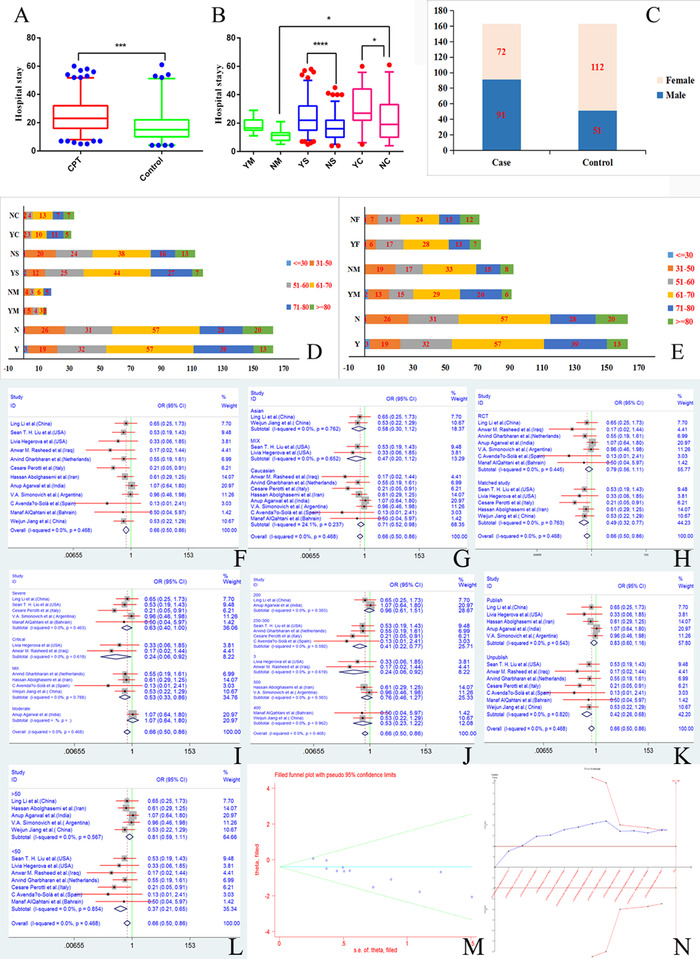
The basic characteristics of all participants and the association between CPT and the rate of mortality. (A‐E) The basic characteristics of all participants. (A) Days of hospital stay in case with CPT groups and matched control group. (B) Days of hospital stay in case and control under severity subgroup. (C) Distribution of male and female in case with CPT groups and matched control group. (D) Age distribution in case with CPT groups and matched control group under severity subgroup. (E) Age distribution in case with CPT groups and matched control group under gender subgroup, *P < .05 (Student's t‐test). (F–N) The association between CPT and the rate of mortality. (F) Forest plot for overall analysis. (G) Forest plot for race subgroup analysis. (H) Design subgroup analysis. (I) Forest plot for severity subgroup analysis. (J) Forest plot for dose of CPT subgroup analysis. (K) Forest plot for article states subgroup analysis. (L) Forest plot for case size subgroup analysis. (M) The funnel plot for the association between CPT and the rate of mortality. (N) Trial sequential analysis of CPT and the rate of mortality