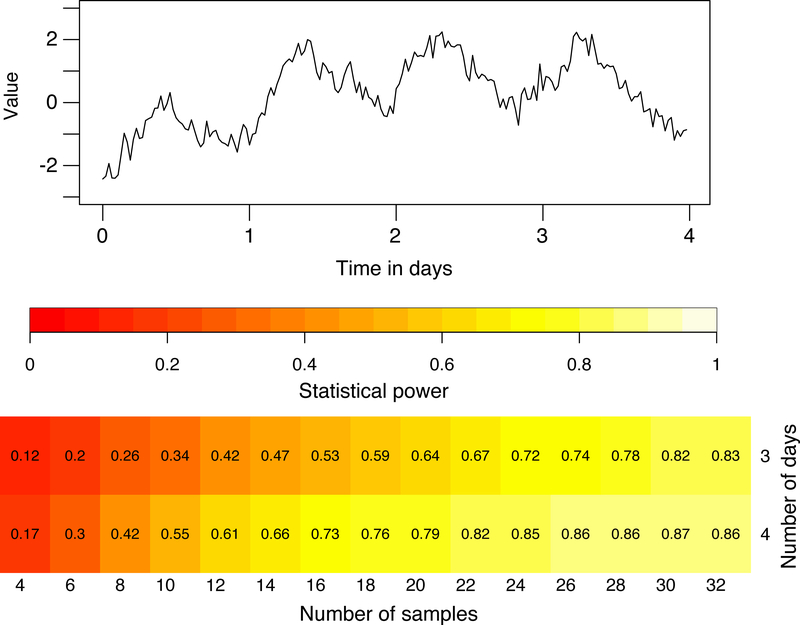
Figure 3.
Power study using generated time series. Top: example of a 4-day noisy sinusoid. Bottom: Probability of detecting a significant different in sine-fit period between two groups for the indicated number of samples and length of time series (using t.test in R), where the true means are 23.35 and 23.85 h. Periods within each group are normally distributed with standard deviation 0.25h, amplitude is 1, noise is pink with standard deviation is 0.5, trend is quadratic, and a sampling interval is 0.5h. Around 30 samples would be needed to obtain a statistical power of 0.80 using a 3-day duration, while increasing the duration to 4 days substantially decreases the required sample size to just over 20.

