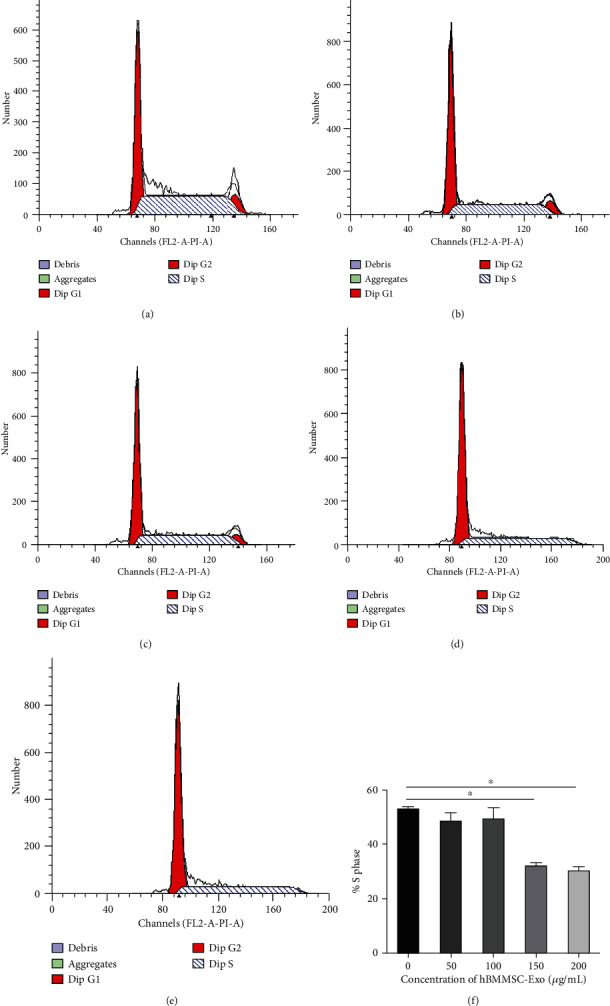
Figure 3.

Bone marrow MSC-Exo arrested CML cell cycle. Cell cycle analysis was performed after K562 cells were treated with hBMMSC-Exo (0, 50, 100, 150, and 200 μg/mL) for 48 h: (a) control group; (b) 50 μg/mL group; (c) 100 μg/mL group; (d) 150 μg/mL group; (e) 200 μg/mL group. (f) Representative cell cycle analysis of the S phase in K562 cells after hBMMSC-Exo treatment. The data were expressed as the mean ± SD of the three independent experiments. ∗p < 0.05 Student's t-test.
