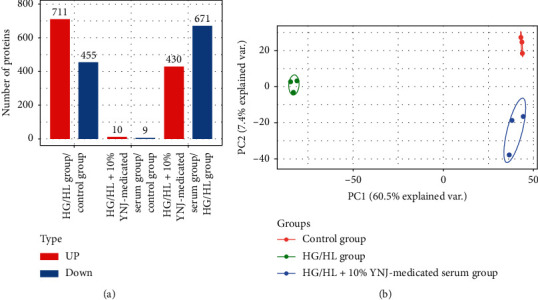
Figure 2.

The results of differentially expressed proteins and sample repeatability tests in three groups. (a) Histogram of the number distribution of differentially expressed proteins: 10 differential proteins were upregulated and 9 were downregulated in the HG/HL+10% YNJ-medicated serum group when compared with the control group; 430 differential proteins were upregulated and 671 were downregulated in the HG/HL+10% YNJ-medicated serum group when compared with the HG/HL group; 711 differential proteins were upregulated and 455 were downregulated in the HG/HL group when compared with the control group. (b) Two-dimensional scatter plot of principal component analysis (PCA) distribution of three samples using quantified proteins. Three biological replicates were performed in this study.
