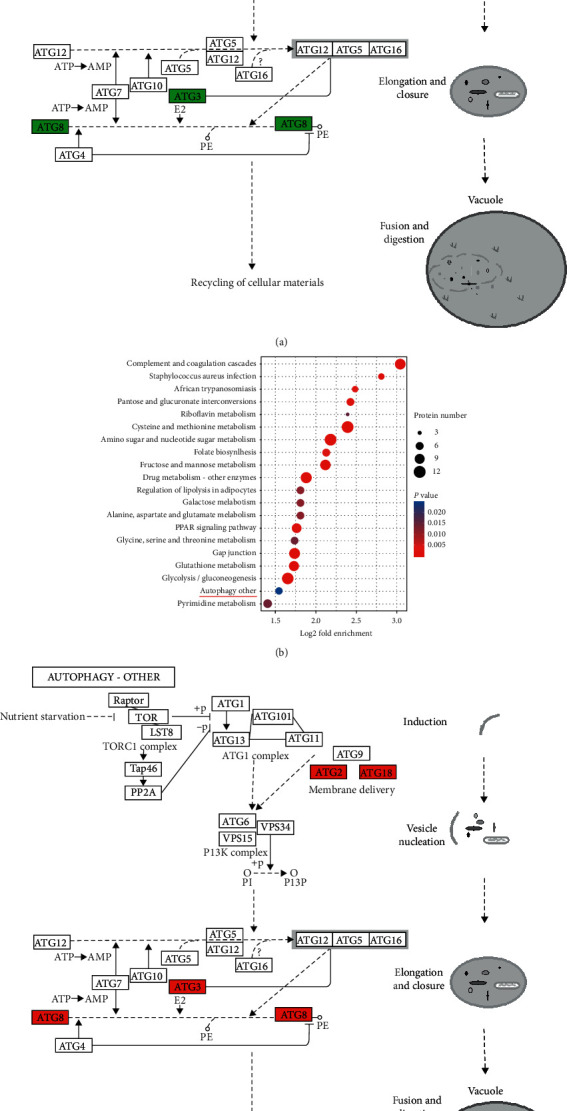
Figure 5.

KEGG pathway enrichment showing significant enrichment of differentially expressed genes in signaling pathways. (a) Downregulated differentially expressed genes in the autophagy pathway in the HG/HL group compared with the control group. (b, c) Upregulated differentially expressed genes in the autophagy pathway in the HG/HL+10% YNJ-medicated serum group compared with the HG/HL group. The red color represents that the protein was upregulated, and the green color represents that the protein was downregulated.
