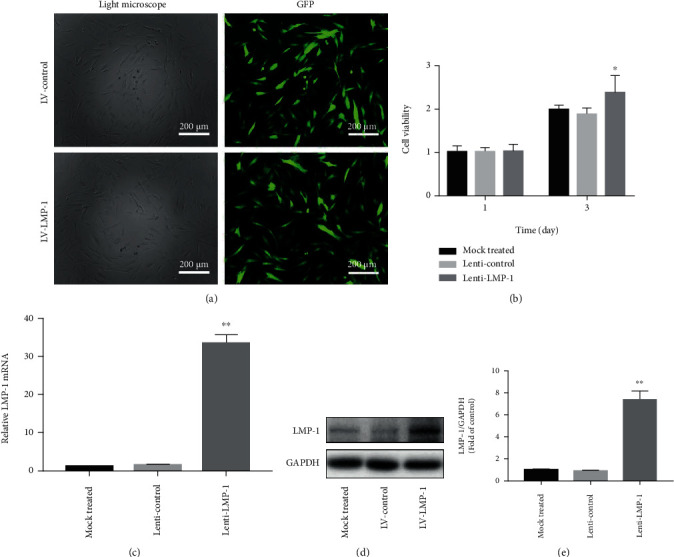
Figure 2.

The construction of LMP-1 overexpression and lenti-control NPCs. (a) NPCs after lentiviral transfection and puromycin screening were observed under a normal microscope and a fluorescence microscope. (b) Cell viability was measured by CCK-8 on days 1 and 3. (c) The gene expression level of LMP-1 was determined by RT-qPCR and normalized to 18 s. (d) The protein expression of LMP-1 in each group was determined by western blotting analysis. (e) The protein expression of LMP-1 was quantified. Data represent mean ± SD; ∗p < 0.05, ∗∗p < 0.01 vs. the mock treated group. Scale bar = 200 μm.
