
Figure 5.
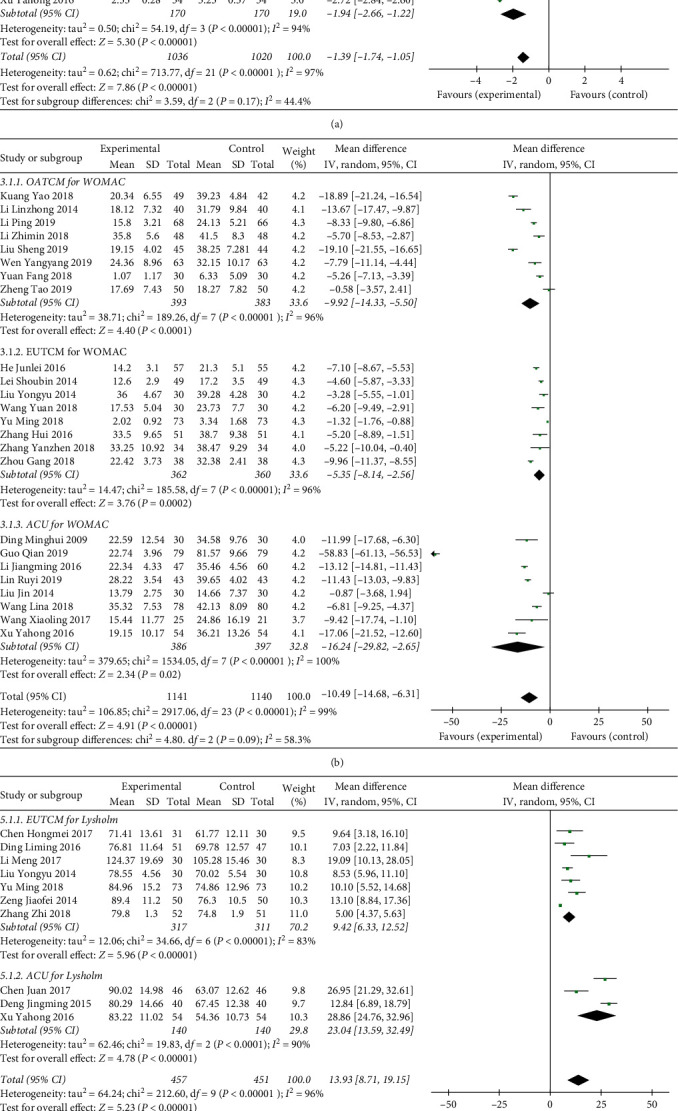
Forest plot of self-activity score in patients treated with TCM therapy and Western medicine therapy. (a) The plot of VAS, (b) the plot of WOMAC, (c) the plot of Lysholm, and (d) the plot of SSTCM. (I)2 and (P) are the criteria for the heterogeneity test, ◆: pooled mean difference, —■—: mean difference, and 95%CI.