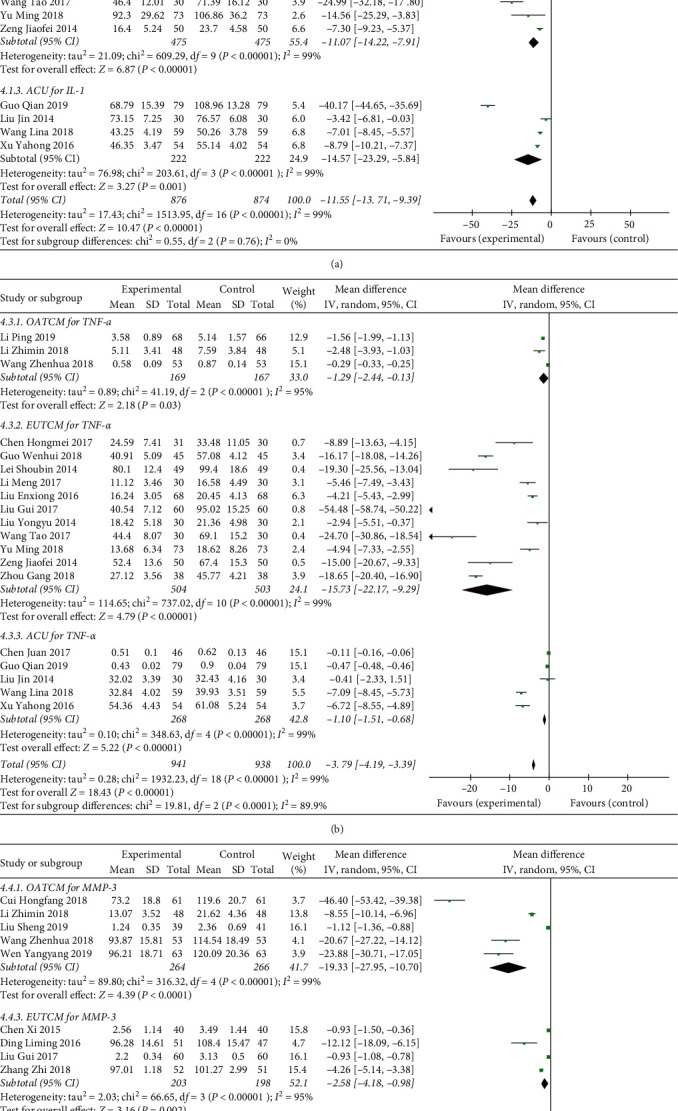
Figure 6.

Forest plot of inflammatory cytokines in patients treated with TCM therapy and Western medicine therapy. (a) The plot of IL-1, (b) the plot of TNF-α, and (c) the plot of MMP-3. (I)2 and (P) are the criteria for the heterogeneity test. ◆: pooled mean difference, —■—: mean difference, and 95%CI. In the detection of inflammatory factors, due to differences in treatment methods, treatment cycles, detection environments, detection instruments, and detection personnel, the detection values vary greatly, but the directions are the same. Therefore, this indicator can be evaluated by the evaluation manager 5.3.
