
FIGURE 4.
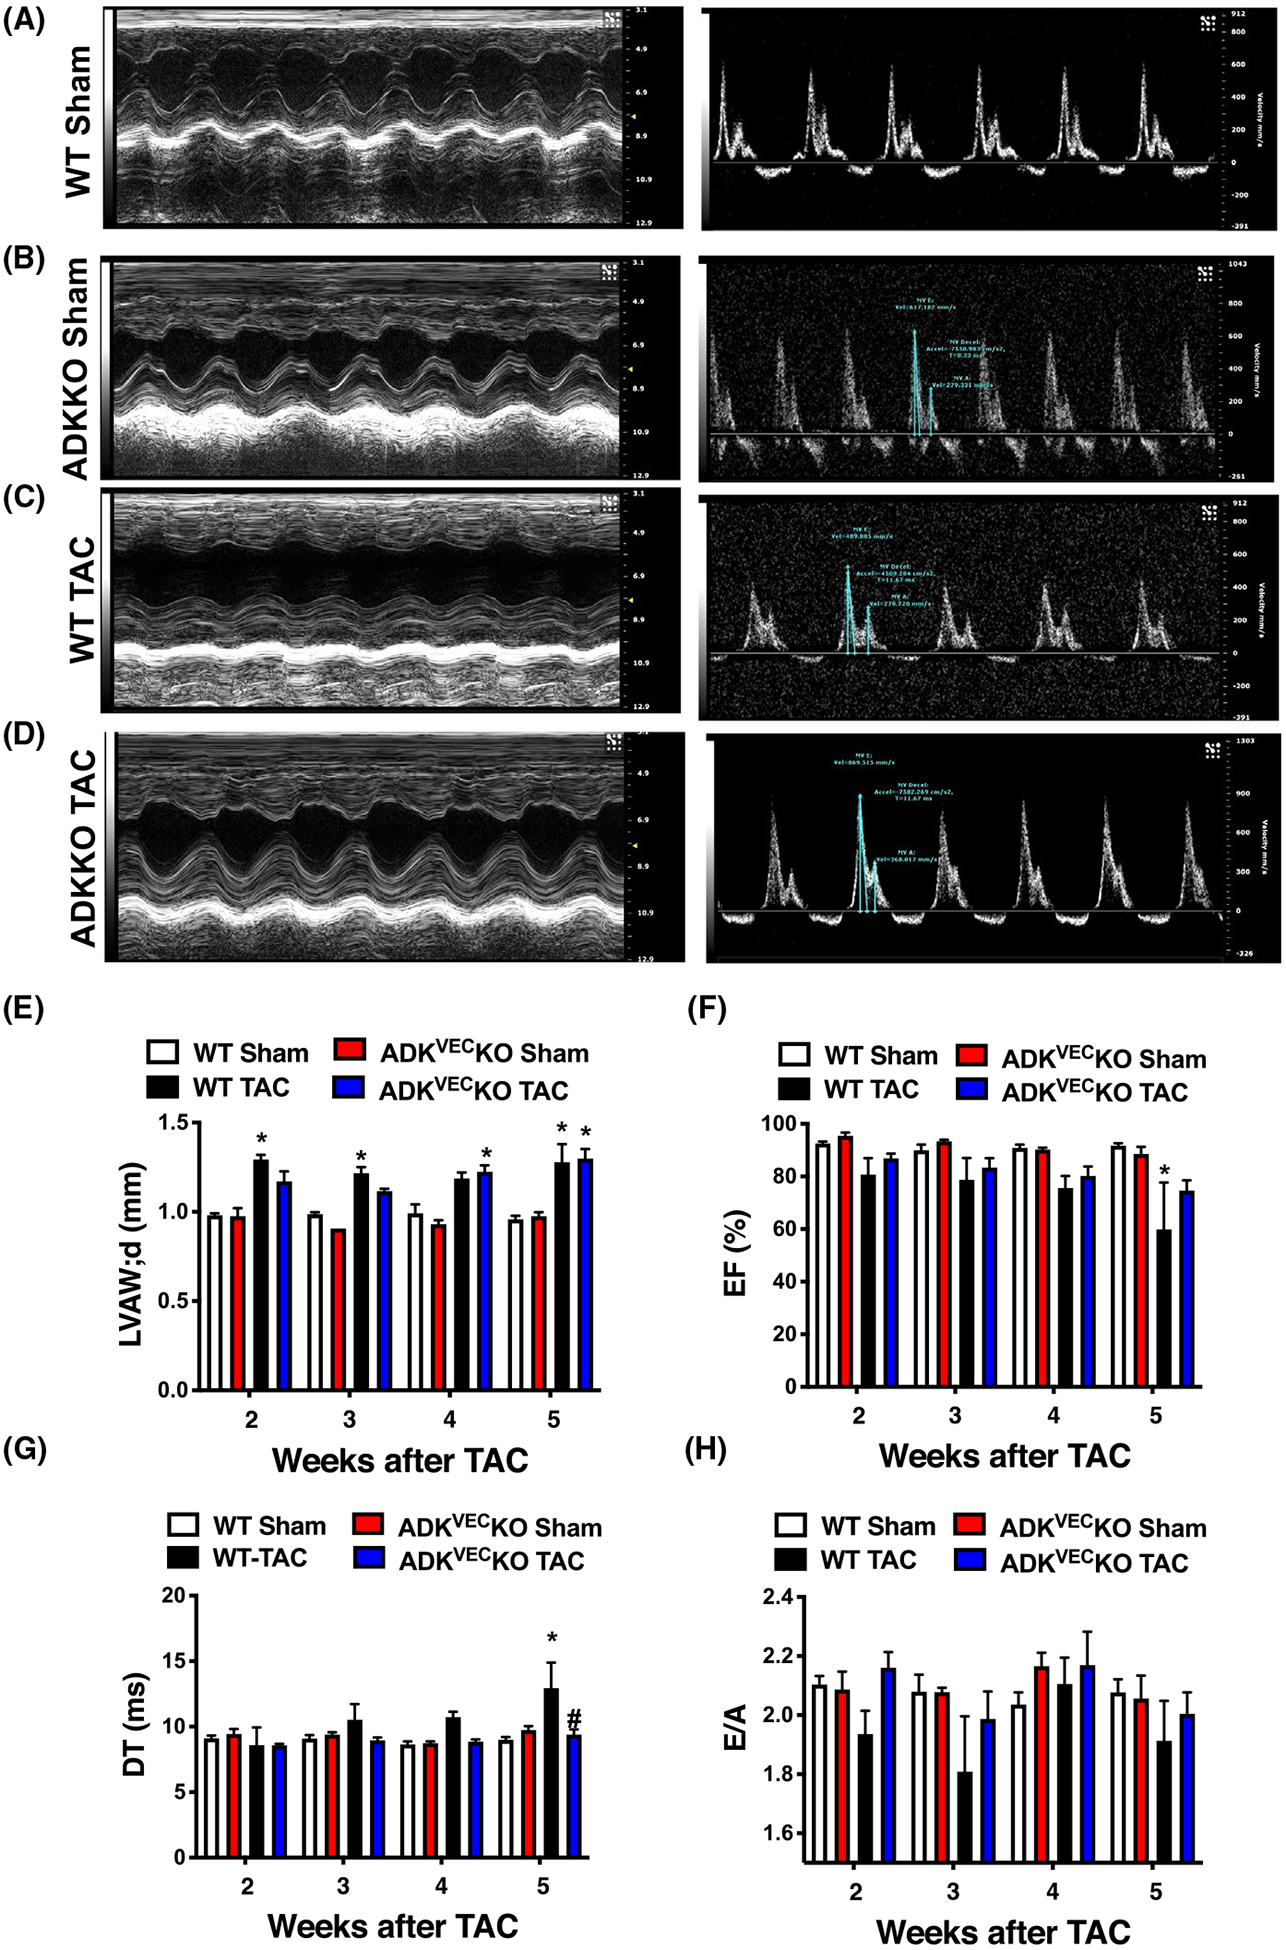
Echocardiographic assessment of WT and ADKVEC-KO mice with TAC. Representative echocardiogram images (Panels A-D) and summary data (Panels E-H) of echocardiogram parameters in WT and ADKVEC-KO mice after sham operation or after TAC surgery (N = 4–5 in each groups). *P < .05 compared to sham-operated WT mice. #P < .05 compared to WT TAC mice