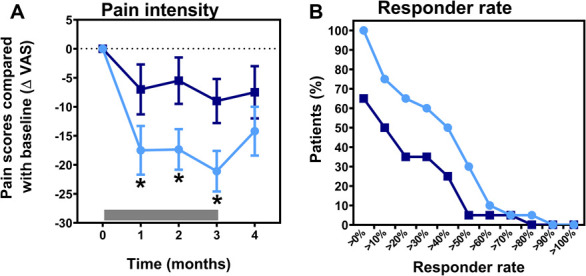
Figure 3.

(A) Change in the pain score compared with baseline during and after treatment with tapentadol (light blue circles) and placebo (dark blue squares). The gray bar indicates the treatment period. Tapentadol significantly reduced spontaneous pain scores compared with placebo (P = 0.025). (B) Graph of the analgesia responder rate for predefined response rates in the range between 0% and 100%. ΔVAS, delta visual analogue scale; *Significant change in the pain score between tapentadol and placebo.
