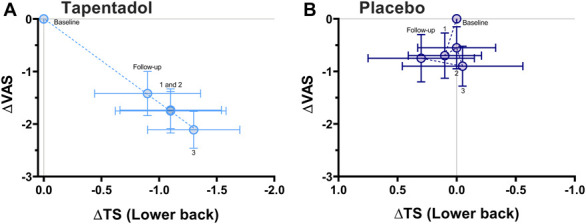
Figure 5.

Correlation between TS responses of the lower back and spontaneous pain scores for tapentadol (A) and placebo treatment (B). A significant correlation was observed for the patients treated with tapentadol (r2 = 0.99, P < 0.001). No correlation was observed after treatment with placebo (r2 = 0.06, P = 0.695). The numbers in the graph indicate the treatment month. ΔVAS, delta visual analogue scale; ΔTS, delta temporal summation.
