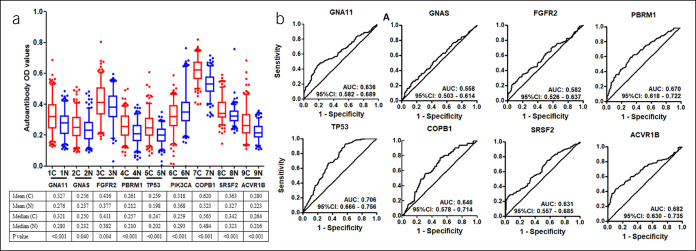
Figure 3.
(a) Serum levels (optical density, OD) of 9 autoantibodies in patients with gastric cancer and normal individuals in the training cohort. The line and whiskers within a box marks the median and 5–95 percentiles, respectively. C (N = 205); N (N = 205). P < 0.05 (Mann-Whitney U test) showed that the median OD value was significantly higher in gastric cancer sera than that in normal controls. (b) Receiver operating characteristic curves of gastric cancer versus normal controls for 8 significant TAAs using ELISA OD. C, cancer; CI, confidence interval; ELISA, enzyme-linked immunosorbent assay; N, normal; TAA, tumor-associated antigen.

