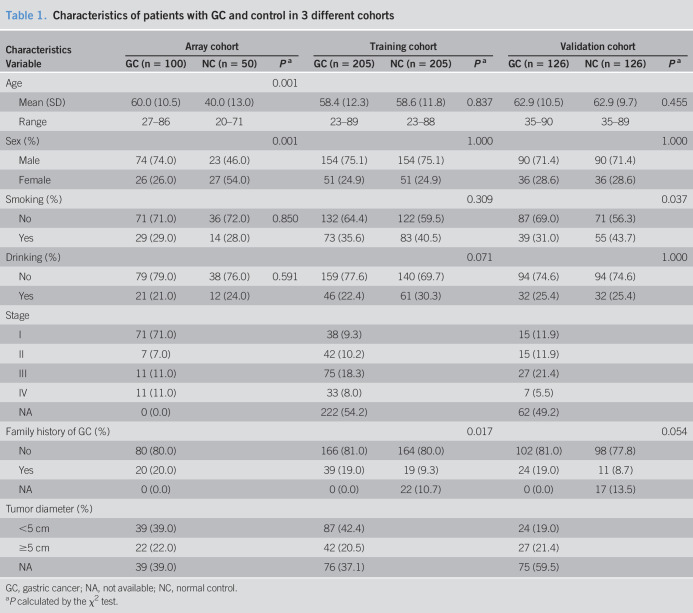
Table 1.
Characteristics of patients with GC and control in 3 different cohorts
| Characteristics | Array cohort | Training cohort | Validation cohort | ||||||
| Variable | GC (n = 100) | NC (n = 50) | Pa | GC (n = 205) | NC (n = 205) | Pa | GC (n = 126) | NC (n = 126) | Pa |
| Age | 0.001 | ||||||||
| Mean (SD) | 60.0 (10.5) | 40.0 (13.0) | 58.4 (12.3) | 58.6 (11.8) | 0.837 | 62.9 (10.5) | 62.9 (9.7) | 0.455 | |
| Range | 27–86 | 20–71 | 23–89 | 23–88 | 35–90 | 35–89 | |||
| Sex (%) | 0.001 | 1.000 | 1.000 | ||||||
| Male | 74 (74.0) | 23 (46.0) | 154 (75.1) | 154 (75.1) | 90 (71.4) | 90 (71.4) | |||
| Female | 26 (26.0) | 27 (54.0) | 51 (24.9) | 51 (24.9) | 36 (28.6) | 36 (28.6) | |||
| Smoking (%) | 0.309 | 0.037 | |||||||
| No | 71 (71.0) | 36 (72.0) | 0.850 | 132 (64.4) | 122 (59.5) | 87 (69.0) | 71 (56.3) | ||
| Yes | 29 (29.0) | 14 (28.0) | 73 (35.6) | 83 (40.5) | 39 (31.0) | 55 (43.7) | |||
| Drinking (%) | 0.071 | 1.000 | |||||||
| No | 79 (79.0) | 38 (76.0) | 0.591 | 159 (77.6) | 140 (69.7) | 94 (74.6) | 94 (74.6) | ||
| Yes | 21 (21.0) | 12 (24.0) | 46 (22.4) | 61 (30.3) | 32 (25.4) | 32 (25.4) | |||
| Stage | |||||||||
| I | 71 (71.0) | 38 (9.3) | 15 (11.9) | ||||||
| II | 7 (7.0) | 42 (10.2) | 15 (11.9) | ||||||
| III | 11 (11.0) | 75 (18.3) | 27 (21.4) | ||||||
| IV | 11 (11.0) | 33 (8.0) | 7 (5.5) | ||||||
| NA | 0 (0.0) | 222 (54.2) | 62 (49.2) | ||||||
| Family history of GC (%) | 0.017 | 0.054 | |||||||
| No | 80 (80.0) | 166 (81.0) | 164 (80.0) | 102 (81.0) | 98 (77.8) | ||||
| Yes | 20 (20.0) | 39 (19.0) | 19 (9.3) | 24 (19.0) | 11 (8.7) | ||||
| NA | 0 (0.0) | 0 (0.0) | 22 (10.7) | 0 (0.0) | 17 (13.5) | ||||
| Tumor diameter (%) | |||||||||
| <5 cm | 39 (39.0) | 87 (42.4) | 24 (19.0) | ||||||
| ≥5 cm | 22 (22.0) | 42 (20.5) | 27 (21.4) | ||||||
| NA | 39 (39.0) | 76 (37.1) | 75 (59.5) | ||||||
GC, gastric cancer; NA, not available; NC, normal control.
P calculated by the χ2 test.

