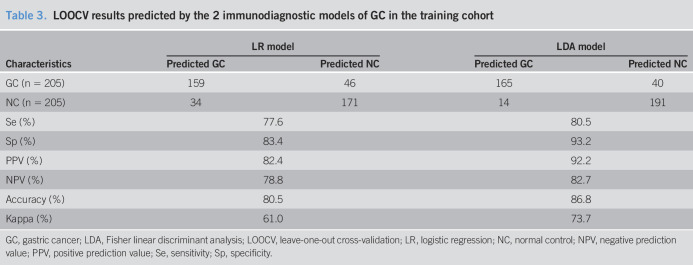
Table 3.
LOOCV results predicted by the 2 immunodiagnostic models of GC in the training cohort
| Characteristics | LR model | LDA model | ||
| Predicted GC | Predicted NC | Predicted GC | Predicted NC | |
| GC (n = 205) | 159 | 46 | 165 | 40 |
| NC (n = 205) | 34 | 171 | 14 | 191 |
| Se (%) | 77.6 | 80.5 | ||
| Sp (%) | 83.4 | 93.2 | ||
| PPV (%) | 82.4 | 92.2 | ||
| NPV (%) | 78.8 | 82.7 | ||
| Accuracy (%) | 80.5 | 86.8 | ||
| Kappa (%) | 61.0 | 73.7 | ||
GC, gastric cancer; LDA, Fisher linear discriminant analysis; LOOCV, leave-one-out cross-validation; LR, logistic regression; NC, normal control; NPV, negative prediction value; PPV, positive prediction value; Se, sensitivity; Sp, specificity.

