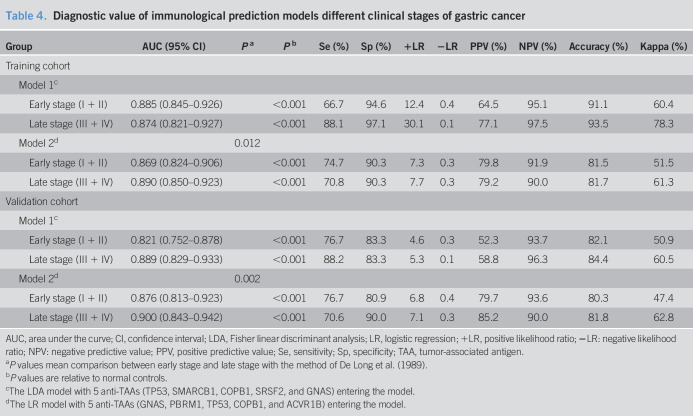
Table 4.
Diagnostic value of immunological prediction models different clinical stages of gastric cancer
| Group | AUC (95% CI) | Pa | Pb | Se (%) | Sp (%) | +LR | −LR | PPV (%) | NPV (%) | Accuracy (%) | Kappa (%) |
| Training cohort | |||||||||||
| Model 1c | |||||||||||
| Early stage (I + II) | 0.885 (0.845–0.926) | <0.001 | 66.7 | 94.6 | 12.4 | 0.4 | 64.5 | 95.1 | 91.1 | 60.4 | |
| Late stage (III + IV) | 0.874 (0.821–0.927) | <0.001 | 88.1 | 97.1 | 30.1 | 0.1 | 77.1 | 97.5 | 93.5 | 78.3 | |
| Model 2d | 0.012 | ||||||||||
| Early stage (I + II) | 0.869 (0.824–0.906) | <0.001 | 74.7 | 90.3 | 7.3 | 0.3 | 79.8 | 91.9 | 81.5 | 51.5 | |
| Late stage (III + IV) | 0.890 (0.850–0.923) | <0.001 | 70.8 | 90.3 | 7.7 | 0.3 | 79.2 | 90.0 | 81.7 | 61.3 | |
| Validation cohort | |||||||||||
| Model 1c | |||||||||||
| Early stage (I + II) | 0.821 (0.752–0.878) | <0.001 | 76.7 | 83.3 | 4.6 | 0.3 | 52.3 | 93.7 | 82.1 | 50.9 | |
| Late stage (III + IV) | 0.889 (0.829–0.933) | <0.001 | 88.2 | 83.3 | 5.3 | 0.1 | 58.8 | 96.3 | 84.4 | 60.5 | |
| Model 2d | 0.002 | ||||||||||
| Early stage (I + II) | 0.876 (0.813–0.923) | <0.001 | 76.7 | 80.9 | 6.8 | 0.4 | 79.7 | 93.6 | 80.3 | 47.4 | |
| Late stage (III + IV) | 0.900 (0.843–0.942) | <0.001 | 70.6 | 90.0 | 7.1 | 0.3 | 85.2 | 90.0 | 81.8 | 62.8 |
AUC, area under the curve; CI, confidence interval; LDA, Fisher linear discriminant analysis; LR, logistic regression; +LR, positive likelihood ratio; −LR: negative likelihood ratio; NPV: negative predictive value; PPV, positive predictive value; Se, sensitivity; Sp, specificity; TAA, tumor-associated antigen.
P values mean comparison between early stage and late stage with the method of De Long et al. (1989).
P values are relative to normal controls.
The LDA model with 5 anti-TAAs (TP53, SMARCB1, COPB1, SRSF2, and GNAS) entering the model.
The LR model with 5 anti-TAAs (GNAS, PBRM1, TP53, COPB1, and ACVR1B) entering the model.

