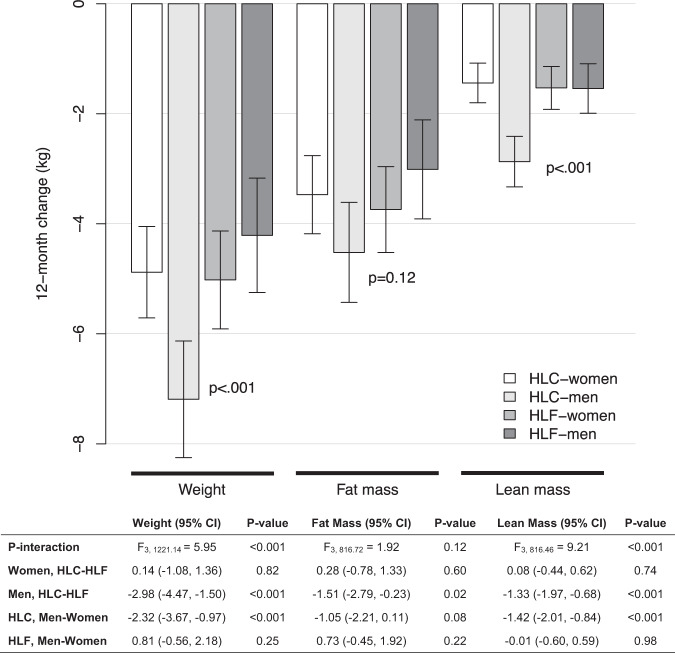
Fig. 1. 12-month changes in weight, fat mass, and lean mass by sex and diet, adjusted for baseline weight and baseline body fat percentage.
Estimated between-group differences (95% CI). Weight data were available at baseline and 3, 6, and 12 months, respectively, as follows: women on HLF, n = 167, 151, 131, 120; women on HLC, n = 179, 155, 144, 131; men on HLF, n = 138, 119, 97, 96; and men on HLC, n = 125, 108, 95, 89. Fat mass and lean mass data were available at baseline, 6, 12 months, respectively, as follows (cohorts 2–5): women on HLF, n = 131, 107, 106; women on HLC, n = 145, 121, 118; men on HLF, n = 97, 75, 79; men on HLC, n = 93, 73, 78.

