FIGURE 1.
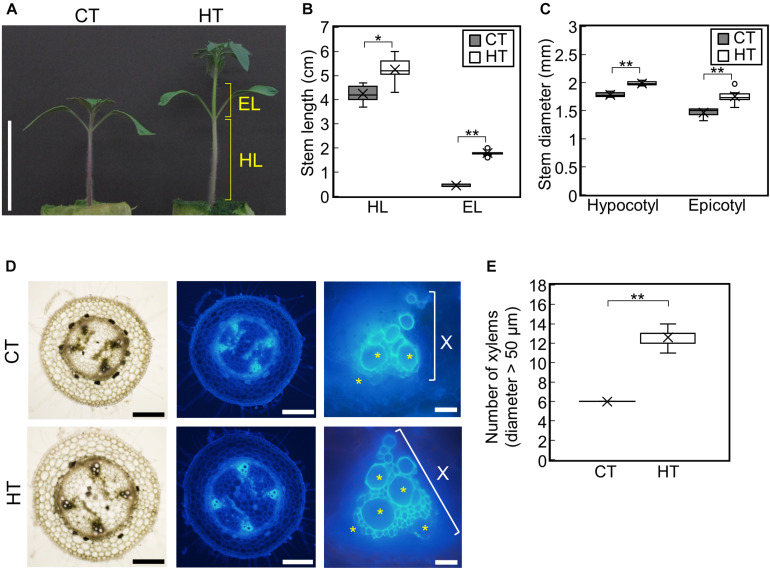
Effect of temperature on growth of tomato seedlings. Young tomato seedlings were grown for 7 days under 25°C/20°C (control temperature) and 30°C/25°C (high temperature). (A), Growth of seedlings. Tomato seedlings were photographed at 7 days. Scale bar = 5 cm. (B), Hypocotyl and epicotyl length. (C), Hypocotyl and epicotyl diameter. Data are shown as boxplots (n = 7). (D), Cross sections of hypocotyls. Asterisks indicate xylems (diameter > 50 μm). Scale bars = 500 μm (left and middle panels) and 50 μm (right panels). (E), Number of xylems (diameter > 50 μm) in the cross section. Data are shown as boxplots (n = 5). Cross marks in boxplot indicate the mean values. *P < 0.01; **P < 0.001 (Student’s t test). CT, control temperature; HT, high temperature; HL, hypocotyl length; EL, epicotyl length; X, xylem area.

