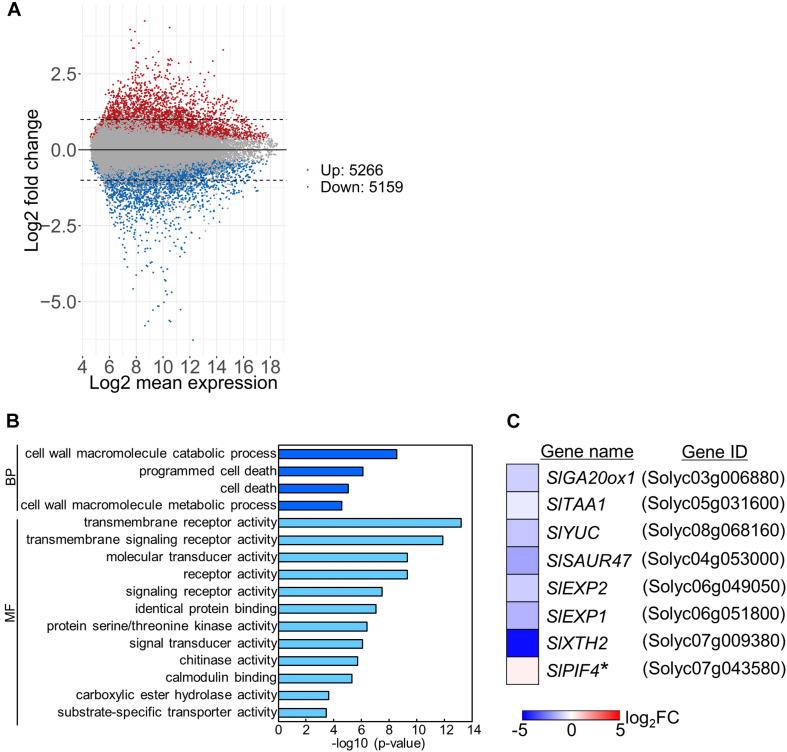
FIGURE 3.
Transcriptome analysis of tomato under positive and negative DIF treatments. Total RNA was extracted from epicotyls of tomato seedlings grown for 7 days under positive DIF and negative DIF and subjected to microarray analysis with three biological replicates. (A), MA plots of microarray data in the positive DIF and negative DIF treatments. Red and blue dots represent genes upregulated (Up: 5266 genes) and downregulated (Down: 5159), respectively, under negative DIF in comparison with positive DIF. Gray dots represent genes that did not significantly differ between DIF treatments. (B), GO terms enriched among the DEGs (top 300 upregulated and top 300 downregulated genes; P < 0.05) identified. (C), List of 8 genes associated with stem elongation. The relative expression level of each gene under negative DIF compared with that under positive DIF is shown on the heatmap, which represents the log2 fold-change (FC). The color scale is shown at the bottom. +DIF, positive DIF; -DIF, negative DIF; BP, Biological Process; MF, Molecular Function.

