
Figure 4. H2O2-stimulated cytochrome c release and apoptosis are decreased in ARVM expressing the SERCA C674S mutant.
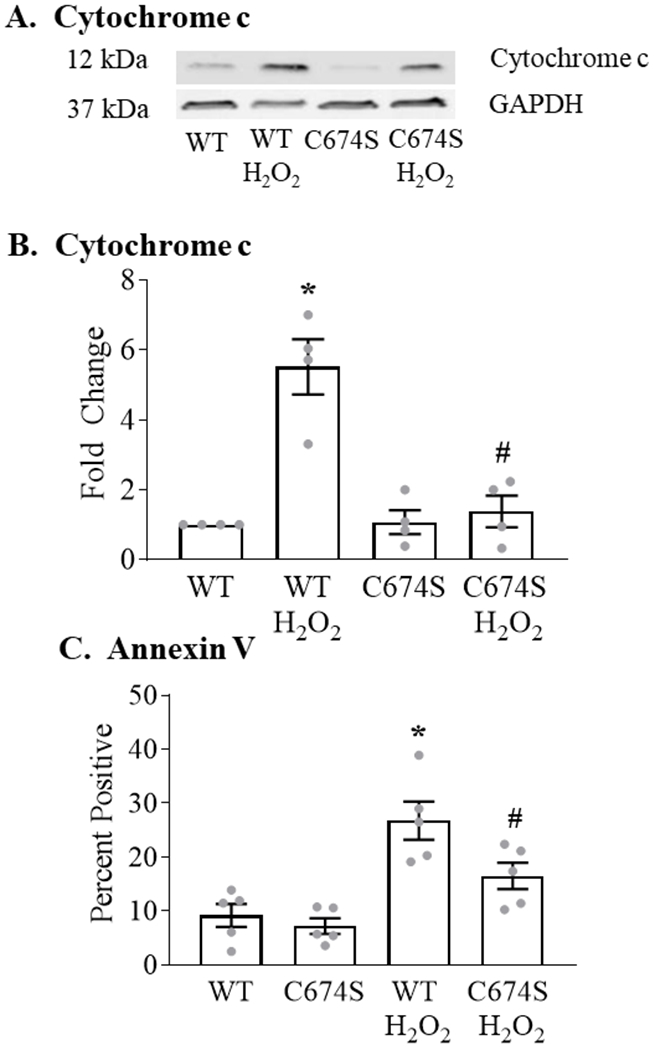
Panel A. Representative Western blot of released cytochrome c measured 6 hours after the addition of H2O2 (100 μM). Panel B. Mean levels of basal and H2O2-stimulated cytochrome c release as per Panel A (n = 4; * = P<0.05 vs. WT; # = 0.05 vs. WT / H2O2; ANOVA with Bonferroni correction). Panel C. Basal and H2O2-stimulated (100 μM; 24 hours) expression of annexin V in ARVM expressing WT or C674S SERCA (n = 4 - 5; * = P<0.01 vs. WT; ANOVA with Bonferroni correction).