Figure 1.

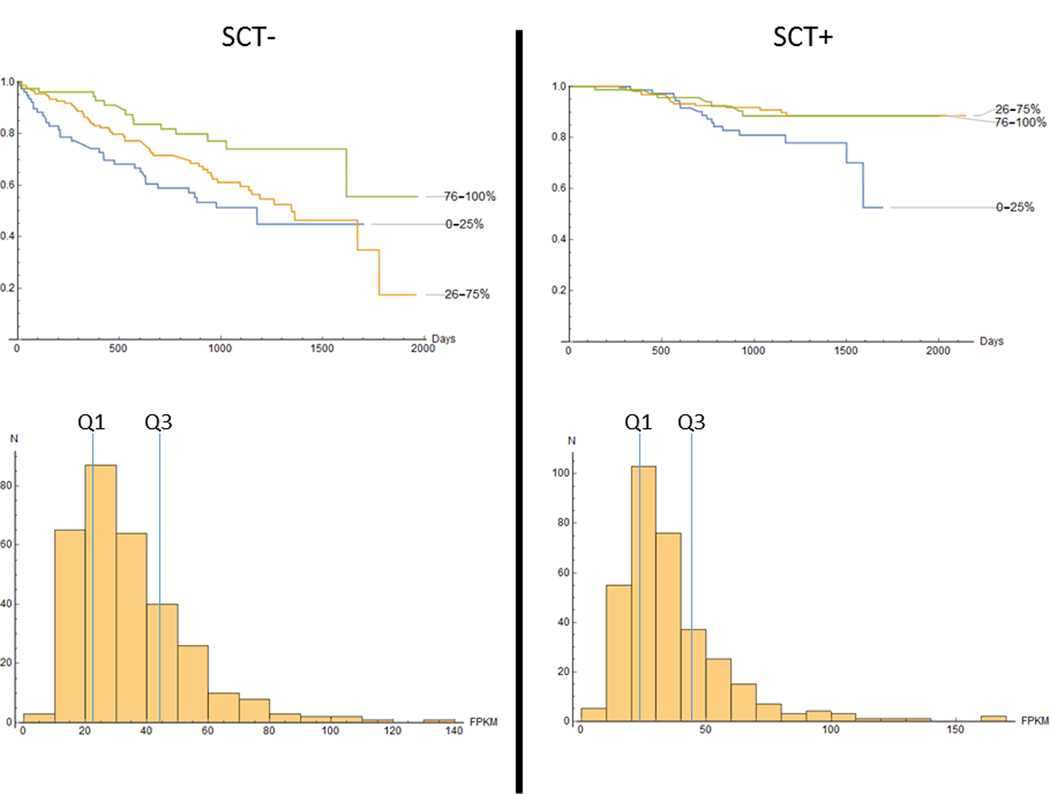
Survival characteristics of the SCT- (left panel) and SCT+ (right panel) patients. Upper row: K-M curves, bottom row: distribution of NR3C1 expression values. Quartiles Q1 and Q3 are marked as blue lines.

Survival characteristics of the SCT- (left panel) and SCT+ (right panel) patients. Upper row: K-M curves, bottom row: distribution of NR3C1 expression values. Quartiles Q1 and Q3 are marked as blue lines.