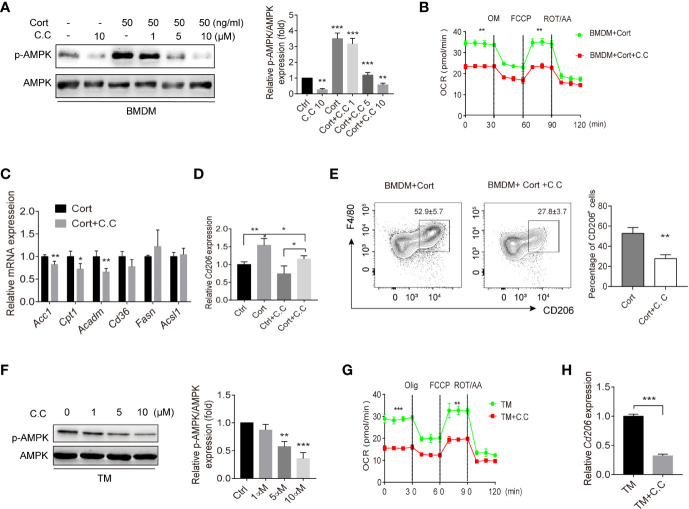
Figure 3.
AMPK inhibition suppresses M2 polarization of BMDM and TM. (A) Corticosterone (50 ng/ml, 7 days)-polarized BMDM were incubated with the AMPK inhibitor Compound C (1–10μM, 3h); p-AMPK protein expression was detected by Western blot. Bar blots represent the relative p-AMPK/AMPK protein level, which was determined from the band intensity using ImageJ software, and normalized relative to the BMDM control samples. (B) The OCR of corticosterone-polarized BMDM (same samples as in Figure 1D ) were compared with BMDM+Compound C treatment. (C, D) The relative mRNA levels of fatty acid metabolism genes and Cd206 in BMDM and corticosterone stimulated (50 ng/ml, 3 h) Expression of Acc1, Cpt1, Acadm, cluster of differentiation 36 (Cd36), Fasn, acyl-coA synthetase long chain family member 1 (Acsl1) in BMDM were quantified by qRT-PCR and normalized against Gapdh (means ± SD Welch’s t-test for C, one way ANOVA for D.) (E) BMDM were stimulated with corticosterone for 7 days with/without daily Compound C (C. C; 10μM) administration. Levels of F4/80 and CD206 were identified by flow cytometry and the representative plot is shown. Bar blot shows the average of CD206+ cell percentage (means ± SD, Welch’s t-test). (F) TM were incubated with Compound C (1–10 μM, 3 h) and p-AMPK protein expression was detected by Western blot and quantified by using ImageJ (G). The OCR of enriched populations of TM (same samples as in Figure 1E ) and Compound C pre-treated TM (10 μM, 0.5 h) were measured in XF-96 assay medium and normalized against protein concentration (H). The relative expression of Cd206 in TM treated with or without Compound C was detected by qRT-PCR and normalized against Gapdh. In all graphs, the error bars represent SEM, whereas results designated with * were significant (P < 0.05), ** (P < 0.005) or (***p < 0.001). These experiments were repeated three times, Welch’s t-test was used.

