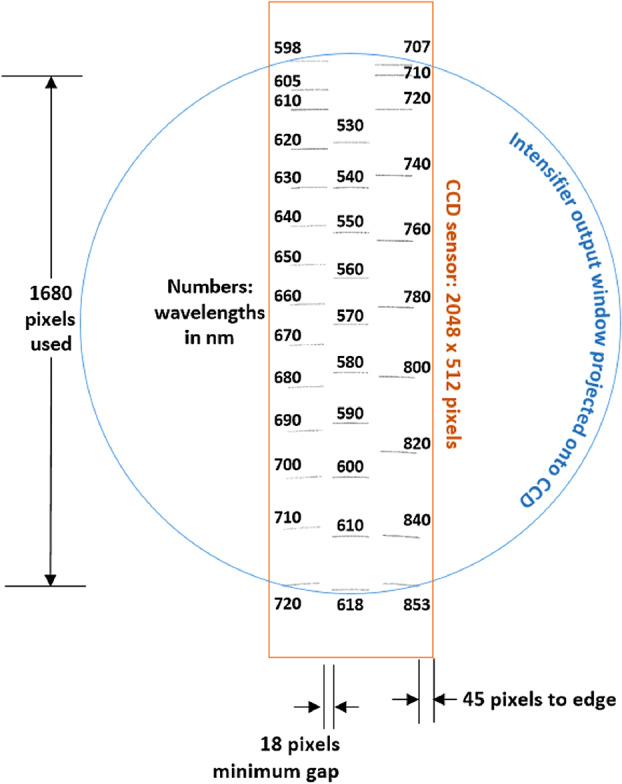
Fig. 16.

Map of spectrometer slit images at various wavelengths (in nm) with the field of view of the intensifier (circle) drawn for scale. The green band (middle, 530–618 nm) starts part-way in from the CCD’s edge in order to optimize the resolution. The orange band (598–720 nm) is projected to the left, and the red band (707–853 nm) to the right. The CCD is read-out from the right side in this orientation. Compare with the bottom panel of Fig. 12
