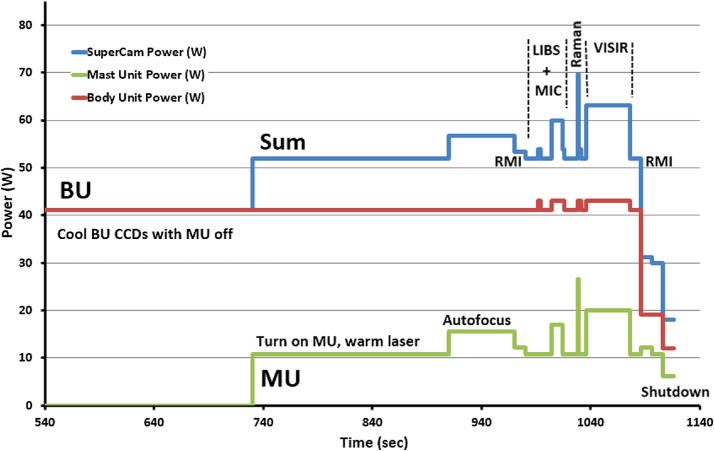
Fig. 33.
Power profile for one observation point, starting with a power-on and warm-up sequence. Note that the y-axis starts at 540 seconds; in this example the first 12 minutes is used exclusively for BU TEC cooling. After that the laser is warmed, followed by autofocus, an RMI image, and spectral collects for LIBS (30 shots at 3 Hz), Raman (10 shots at 10 Hz), and VISIR spectroscopies prior to a final RMI image and shut-down. Total duration is 18 minutes, 36 seconds; total energy is 13.8 W-hr with a maximum power of 69.7 W, and total data volume is 26.5 Mbytes, dominated by the two RMI images

